


BTC Marketcap / Bitcoin
In this BTC daily analysis for 23 February 2026, we see Bitcoin extending its downside sequence after repeated bearish rejections from mid-range resistance. Our technical analysis still treats the structure as an ABC correction within the broader down move, with price now pressing into the lower half of the range and approaching key Fibonacci support and prior liquidity zones.
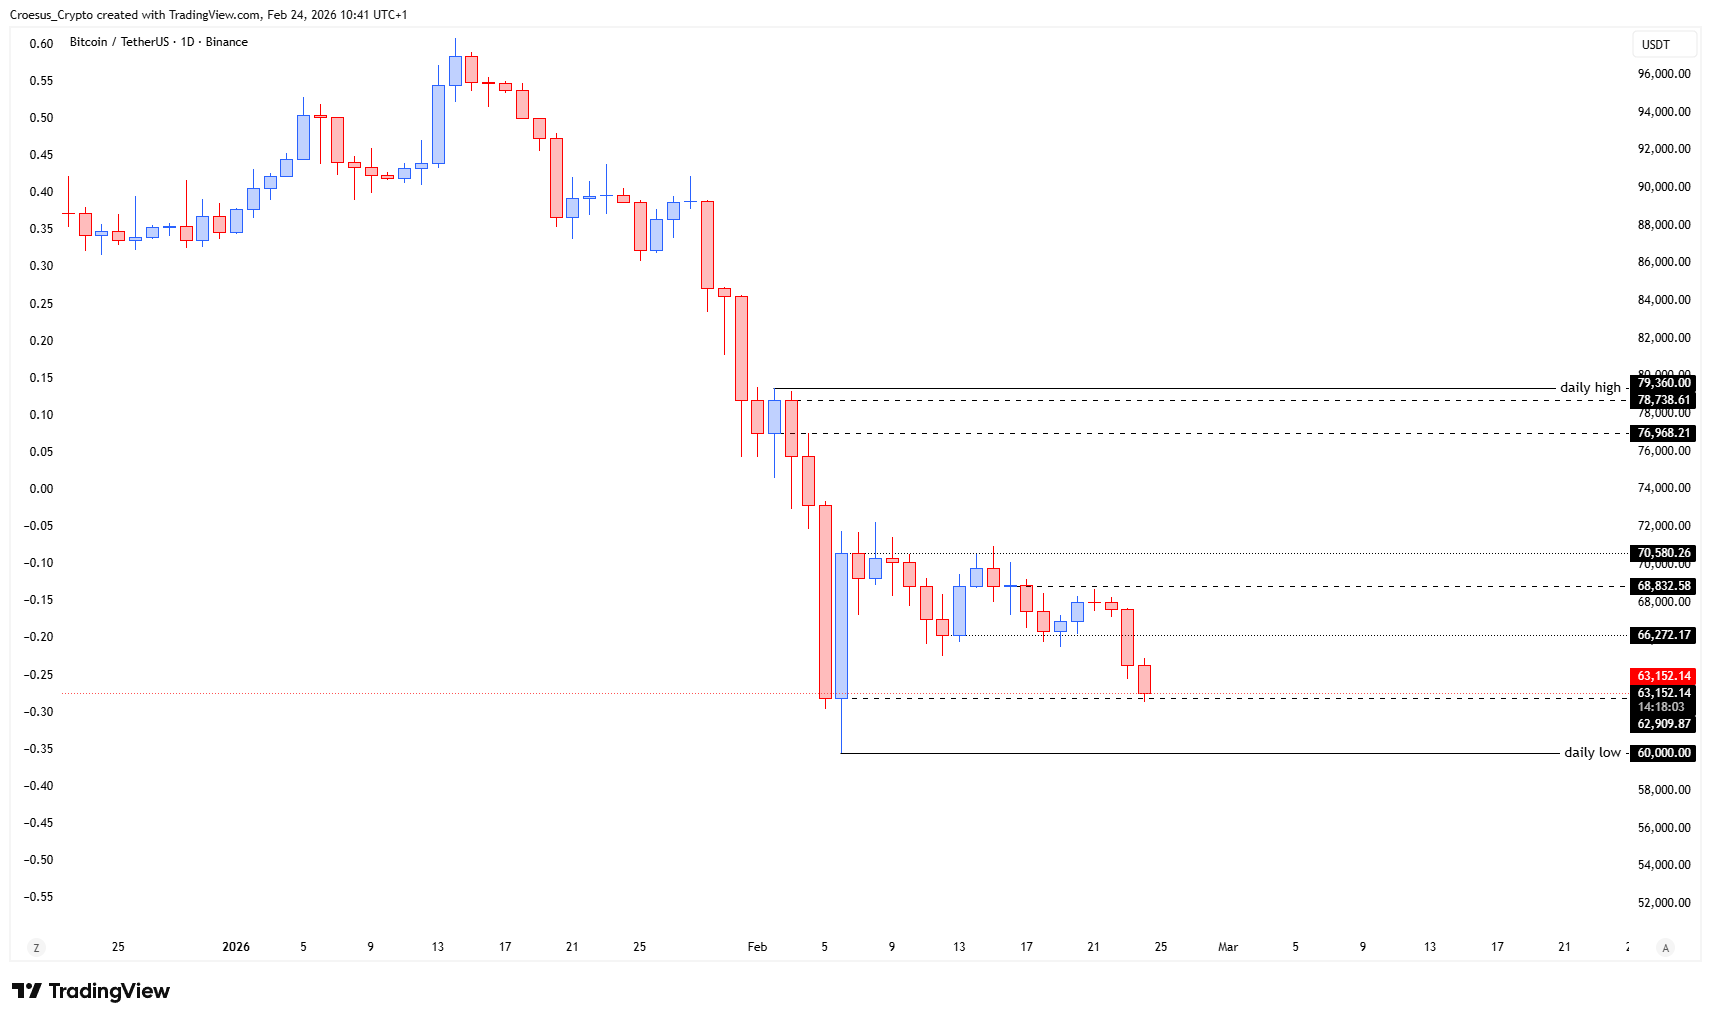
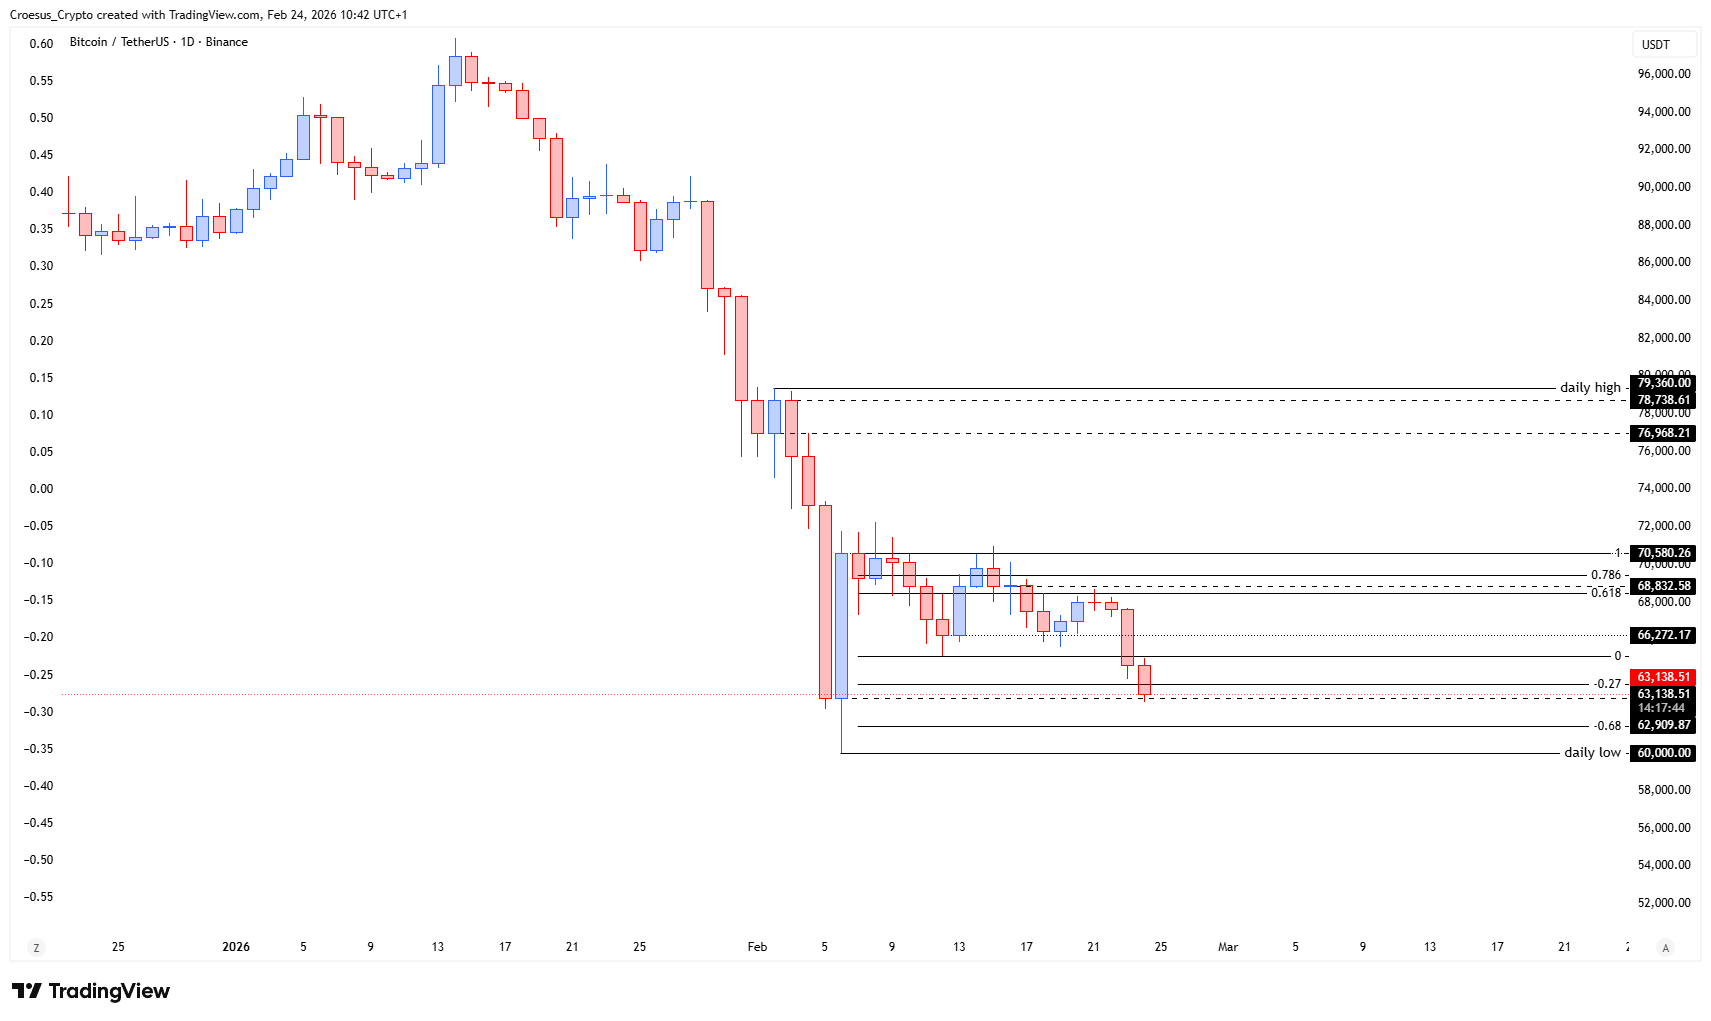
- BTC shows us further bearish rejection.
- But the ABC correction is still in play. As long as we don't see a close below the daily low @60.000 $, the set-up is still valid. But the first point of interest is the fib -0.68 level @61.403 $.
Market Structure Analysis
From a market structure perspective, BTC remains in a clean corrective box following the sharp sell-off earlier this month. The series of lower highs confirms bearish pressure, but as long as price holds above the daily low at 60,000 $, the ABC correction setup stays valid rather than transitioning into a fresh impulsive leg lower.
The -0.68 Fibonacci extension at 61,403 $ is our first meaningful demand zone and aligns with previous reaction levels on the chart. A decisive bounce here could complete the C-leg and open room for a rotation back toward mid-range resistance around 66,000–68,000 $, where support resistance flips are likely to be tested again. A daily close below 60,000 $ would invalidate this corrective view and suggest continuation toward lower time-frame targets.
Key Levels and Scenarios
If buyers step in around the 61,403 $ Fibonacci -0.68 level and defend 60,000 $, a short-covering rally toward 66,000–68,832 $ becomes the bullish scenario, with 70,580 $ as an extended target.
Failure to hold 60,000 $ would flip structure clearly bearish and expose lower support zones.
Critical levels to watch:
- 61,403 $ – Fibonacci -0.68 extension: first major downside point of interest.
- 60,000 $ – Daily low: “line in the sand” for the ABC correction; close below turns structure strongly bearish.
- 66,272 $ – Local range resistance: first upside target on any bounce.
- 68,832 $ – Fibonacci retracement resistance: potential rejection area if C-leg completes.
- 70,580 $ – Upper range resistance: aggressive upside objective if bulls regain control.
Trading Implications
For active traders, the best reward-to-risk is likely around 61,403 $–60,000 $, waiting for clear confirmation before positioning; invalidation sits just below the daily low, while upside targets are staggered across the resistance band toward 70,580 $.
This analysis is for informational purposes only and does not constitute financial advice.