BTC Marketcap / Bitcoin
BTC daily analysis 23/03/2026. Bitcoin is currently trading in a bearish context, but our technical analysis highlights an important reaction from Fibonacci support and a key reclaim of prior structure that can shift short-term control back to buyers if confirmed.

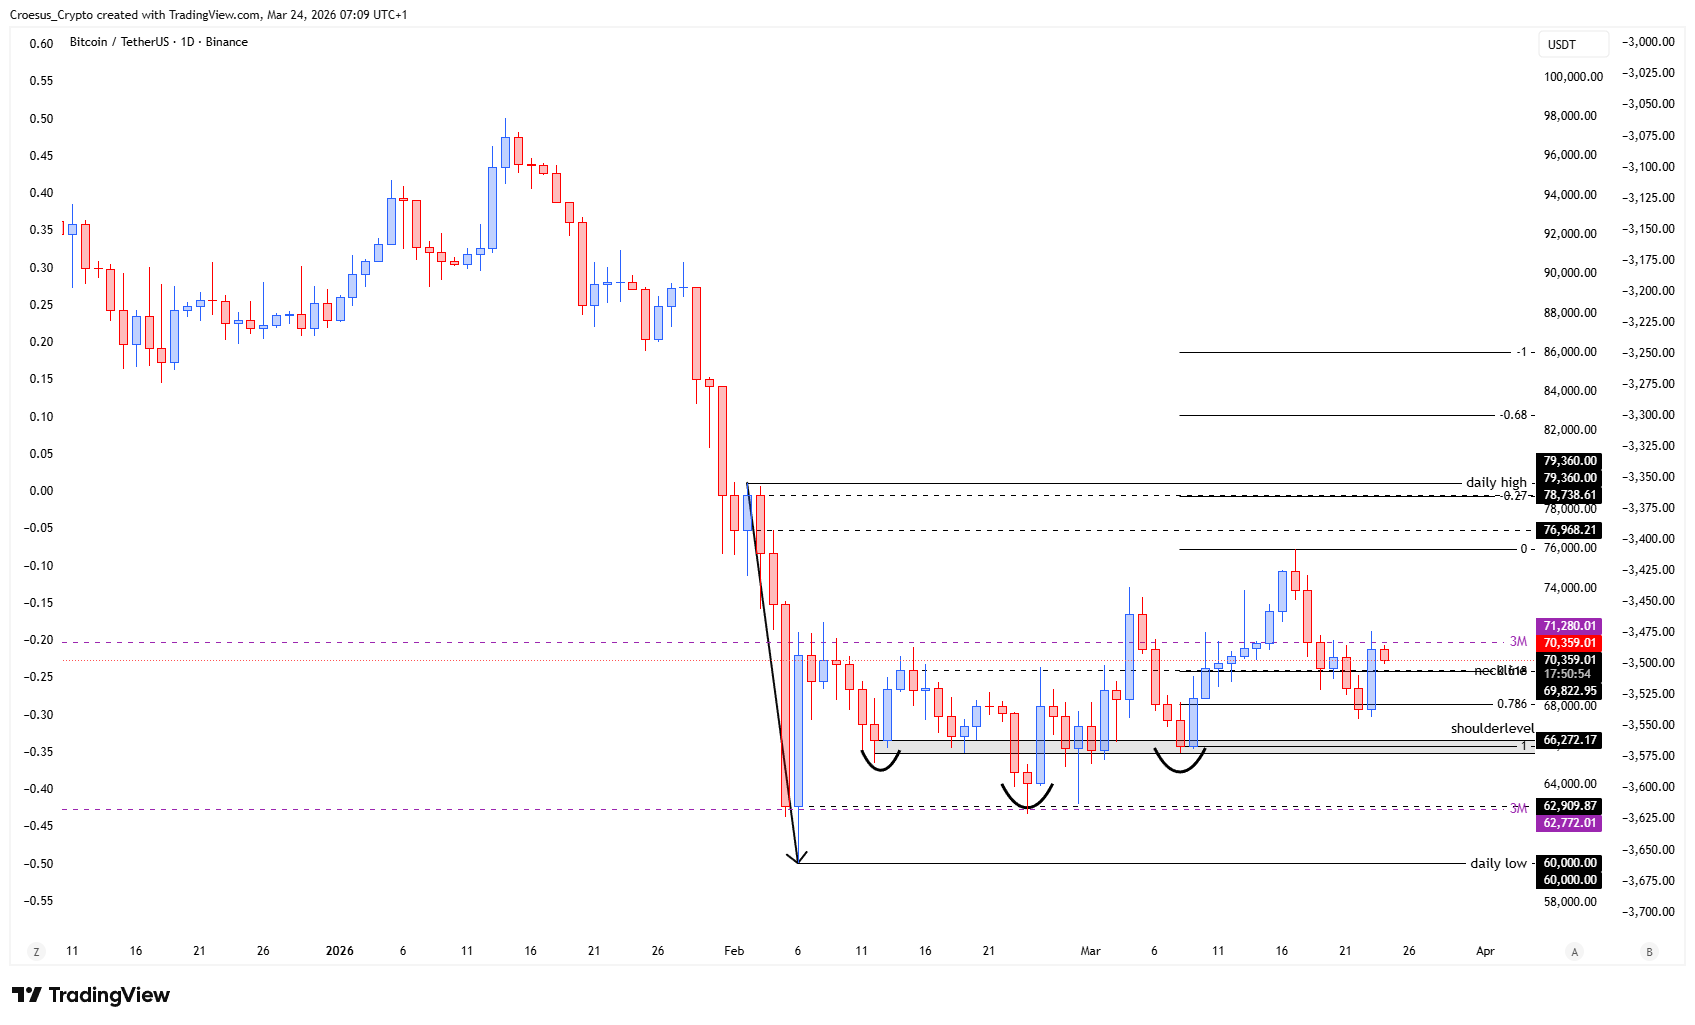
- The BTC price shows that, after hitting the 0.786 Fib level, it reclaimed the neckline
- Turning the neckline back into support could indicate that bulls are regaining strength.
Market Structure Analysis
In this BTC daily analysis, the 0.786 Fibonacci level is acting as a clear reaction zone, suggesting the sell-off is meeting meaningful demand rather than continuing cleanly lower.
Structurally, the key development is the neckline reclaim: in a bearish environment, this type of move often signals that the most recent breakdown is being challenged and that short-term market structure may be attempting to rotate back into a corrective recovery.
The main technical question now is whether the neckline holds as support and flips in favour of bulls. If price accepts above that neckline, it typically reduces immediate downside pressure and can open room for a broader corrective leg; if it fails, the reclaim becomes a bull trap within the prevailing bearish trend.
Key Levels and Scenarios
Bitcoin daily analysis remains bearish overall, so confirmation matters more than the initial bounce. The bullish scenario depends on holding the neckline as support after the reclaim, while the bearish scenario activates if price loses the neckline and slides back toward the Fibonacci reaction zone, signalling sellers are still in control.
- 0.786 Fib level: key demand zone that triggered the current reaction
- Neckline: pivotal support resistance flip level after the reclaim
- Neckline retest area: decision point for continuation vs failed reclaim
- 0.786 Fib re-test: bearish continuation risk if the neckline fails
Trading Implications
With trend still bearish, aggressive participants typically treat this as a corrective opportunity only while structure holds above the neckline, while conservative participants usually wait for a clear hold/acceptance before expecting follow-through. If the neckline cannot be defended, risk shifts back toward continuation of the broader bearish move.
This analysis is for informational purposes only and does not constitute financial advice.