


BTC Marketcap / Bitcoin
In this BTC daily analysis for February 2026, Bitcoin has completed a clean 100% Fibonacci retracement of the A-leg, bringing price back into a key demand zone. From here, our technical analysis considers the potential for an ABC corrective move to unfold, with the C-leg aiming toward the daily high zone, while the broader market context on lower timeframes still leans bearish.
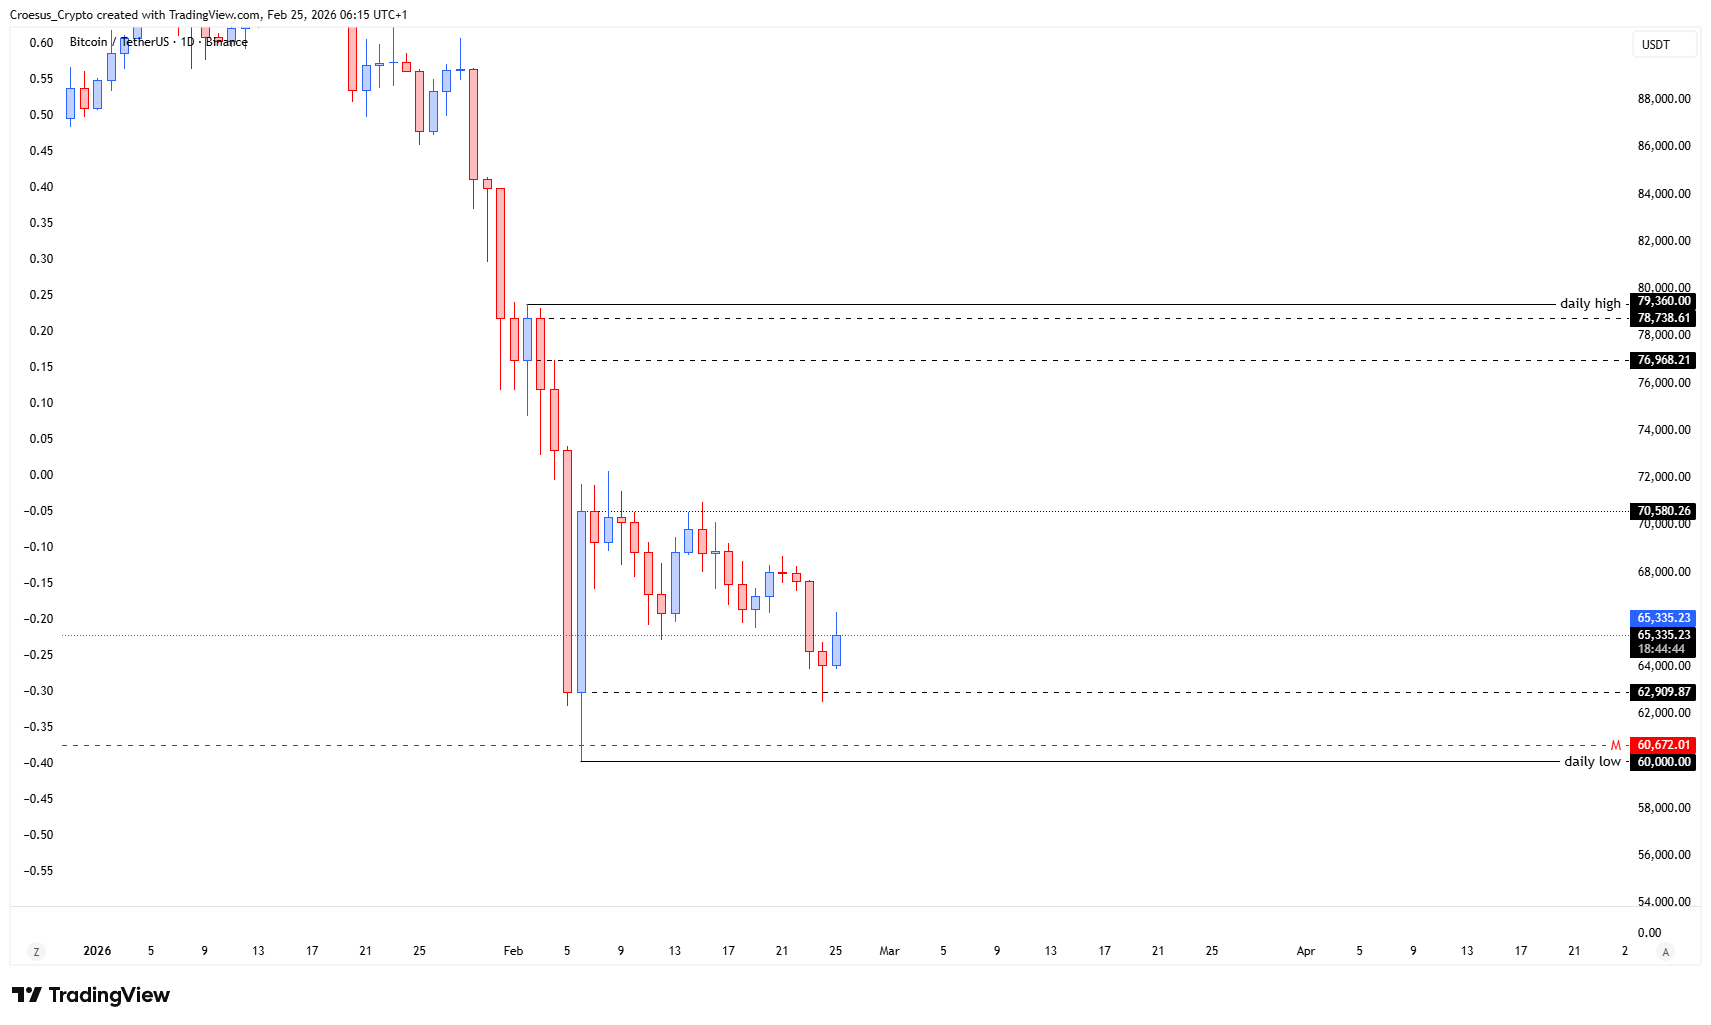
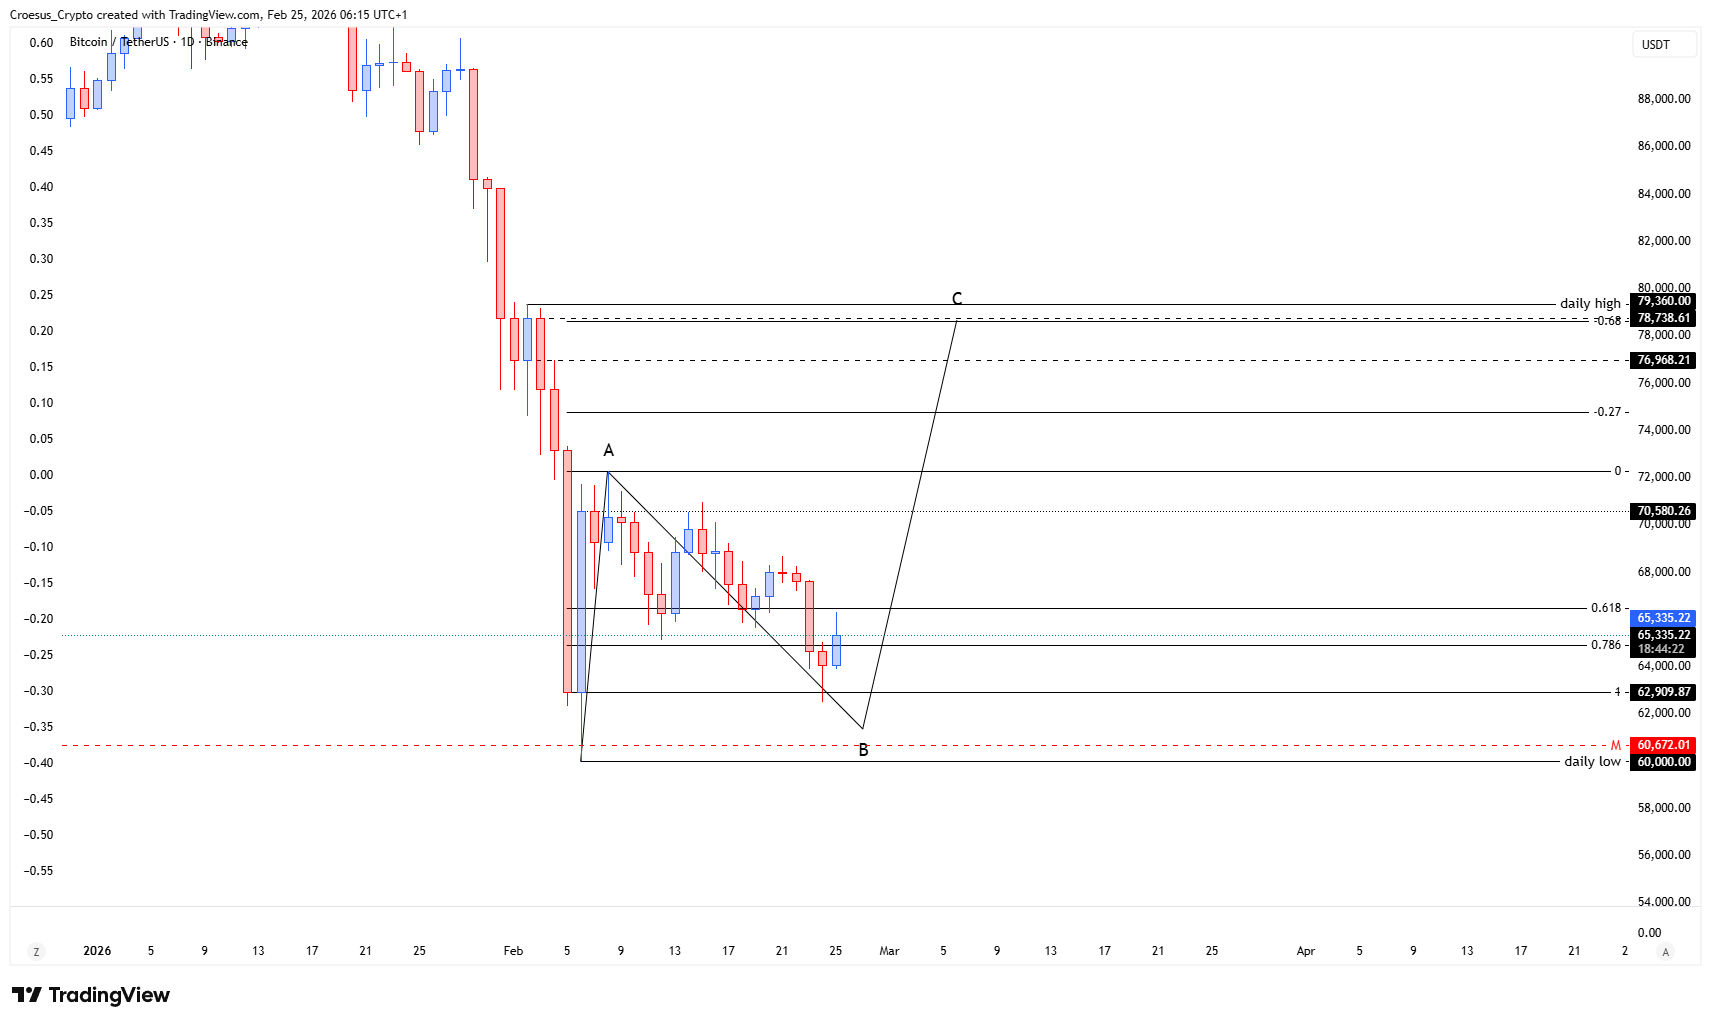
- BTC made the fib 100% retracement of the A-leg.
- we could possibly see a reversal to complete the ABC-correction towards the C-level at the daily highs.
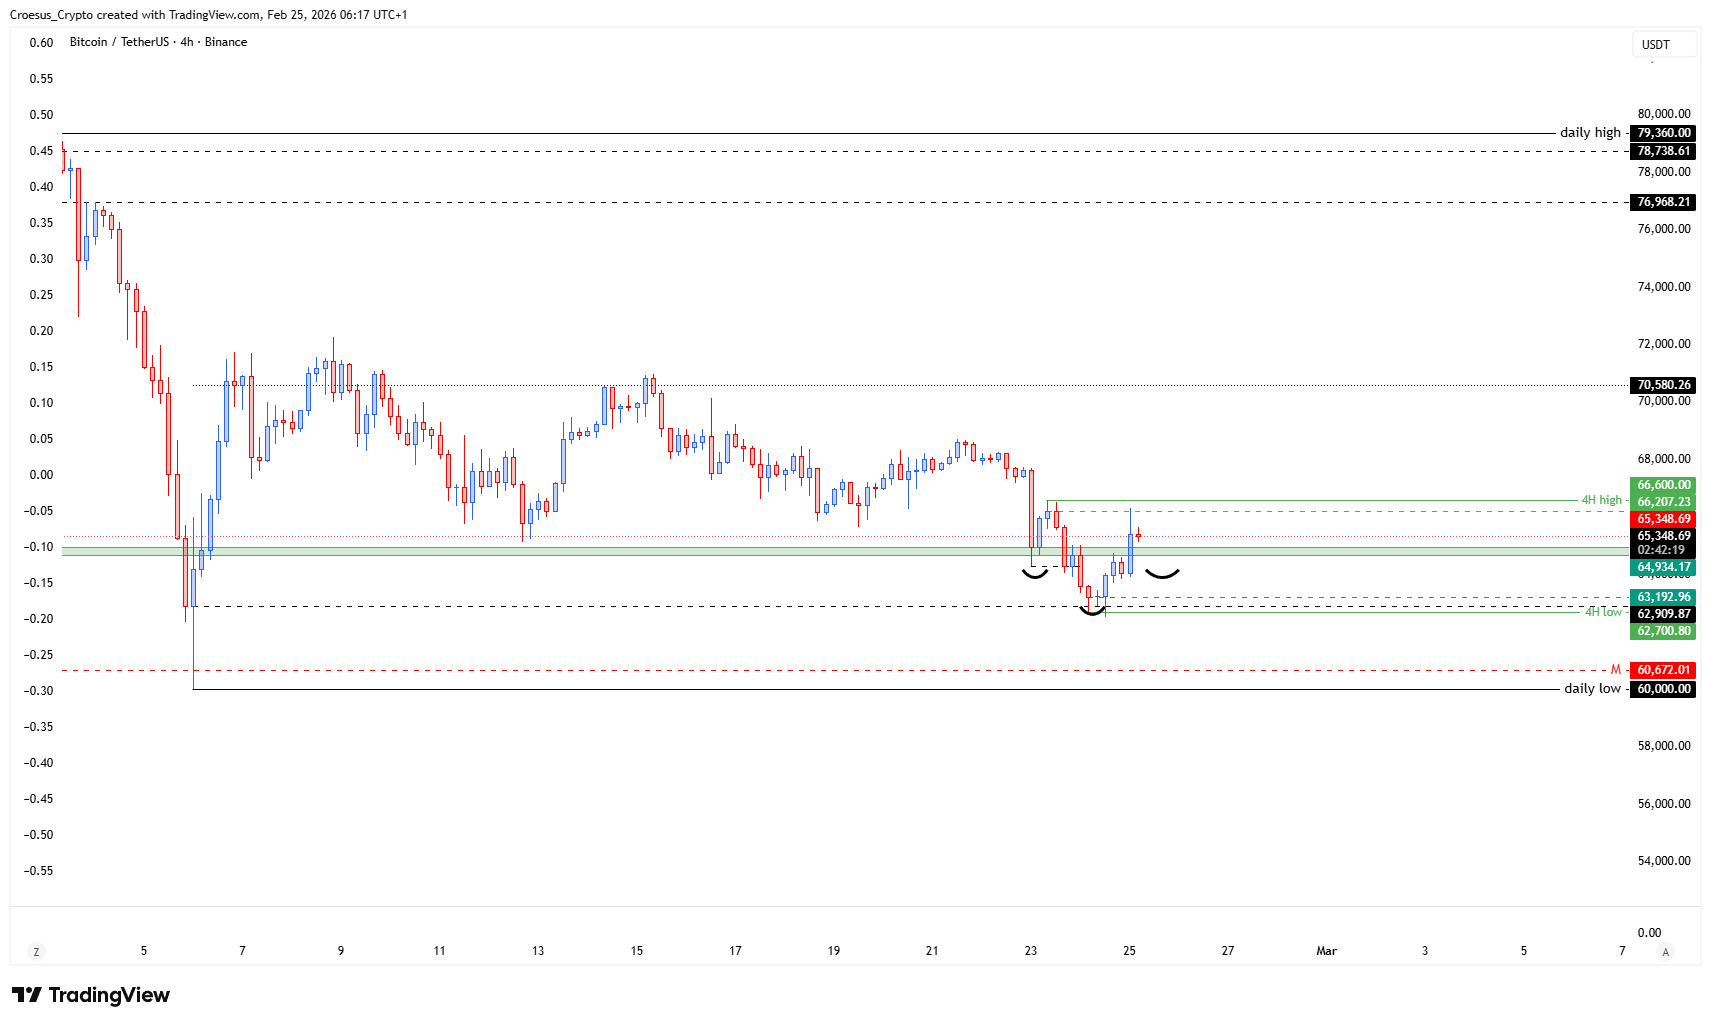
- if we zoom in on the 4H chart, we can see a possible inversed head and shoulder pattern being formed. But as long as we don't break the 4H high, we still remain in a 4H bearish market structure. Entering on this shoulder level is possible and would take the first liquidity, but remains higher risk. As long as we remain in a bearish marketstructure, we can clearly see further bearish correction.
Market Structure Analysis
Our BTC daily analysis views the current move as a completed A–B leg sequence, with B sitting at a full Fibonacci 100% retrace of the A-leg. This creates a clear support resistance flip zone where buyers may attempt to step in and drive an upside corrective wave toward the projected C-level near the daily highs.
On the 4H chart, the emerging inverse head and shoulders sits right at this retracement region, but it remains only a potential pattern. Until the neckline and 4H high are broken, the 4H trend is still bearish, meaning any long positioning here trades against the prevailing market structure and carries elevated risk.
Key Levels and Scenarios
Bullish scenario:
confirmation of the inverse head and shoulders on 4H (break and hold above the 4H high) could start an ABC-correction toward the daily high C-level.
Critical levels to watch:
- 61,403 $ – Fibonacci -0.68 extension: first major downside point of interest.
- 60,000 $ – Daily low: “line in the sand” for the ABC correction; close below turns structure strongly bearish.
- 66,272 $ – Local range resistance: first upside target on any bounce.
- 68,832 $ – Fibonacci retracement resistance: potential rejection area if C-leg completes.
- 70,580 $ – Upper range resistance: aggressive upside objective if bulls regain control.
Trading Implications
Traders considering longs from the shoulder or retracement zone should treat positions as counter-trend, keep position sizes smaller, use tight invalidation below local 4H support, and lock in profits stepwise as price approaches the 4H high and daily resistance.
This analysis is for informational purposes only and does not constitute financial advice.