


BTC Marketcap / Bitcoin
BTC daily analysis 26/02/2026. Bitcoin is showing early signs of a momentum shift after a recent bearish context, with price now interacting with a key reversal structure that can decide whether the move becomes a true break of structure or just another corrective bounce.
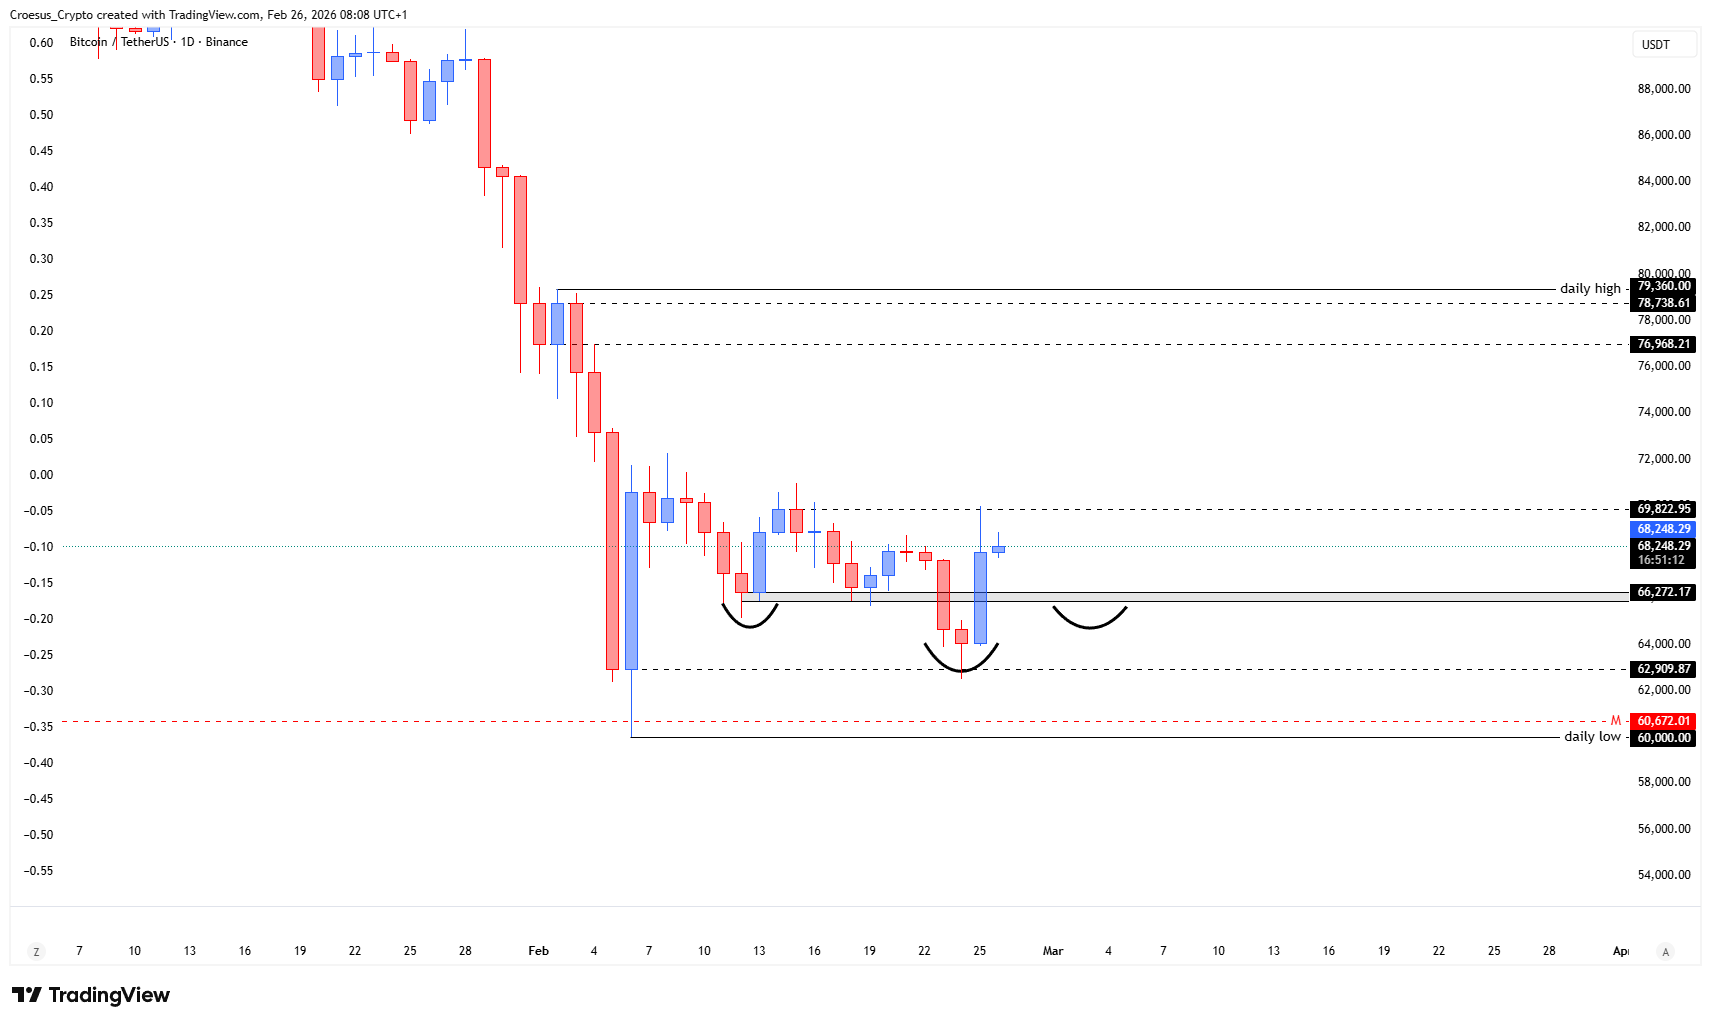
- As analyzed the recent days, we saw what we wanted to see : a switch of momentum.
- The BTC price is printing a reversal pattern : an inversed head & shoulders pattern where the first retest acts as the shoulder level and the second retest acts as the head.
- With yesterday's bullish impuls we saw the neckline been hit
- Either we see a bullish continuation giving is a iHS with break of structure or we see a pullback towards the shoulder level, printing the right shoulder, or we see a pullback even back to the head, giving us a double bottom.
- We still see a lot of space between the first swing low @ 60.000 $ and the recent swing low (head) @ 62.900 $. A lot of retail traders started putting on long trades as soon price started going north, putting their stoploss below the head, creating a pool of liquidity. See the liquidity or be the liquidity !
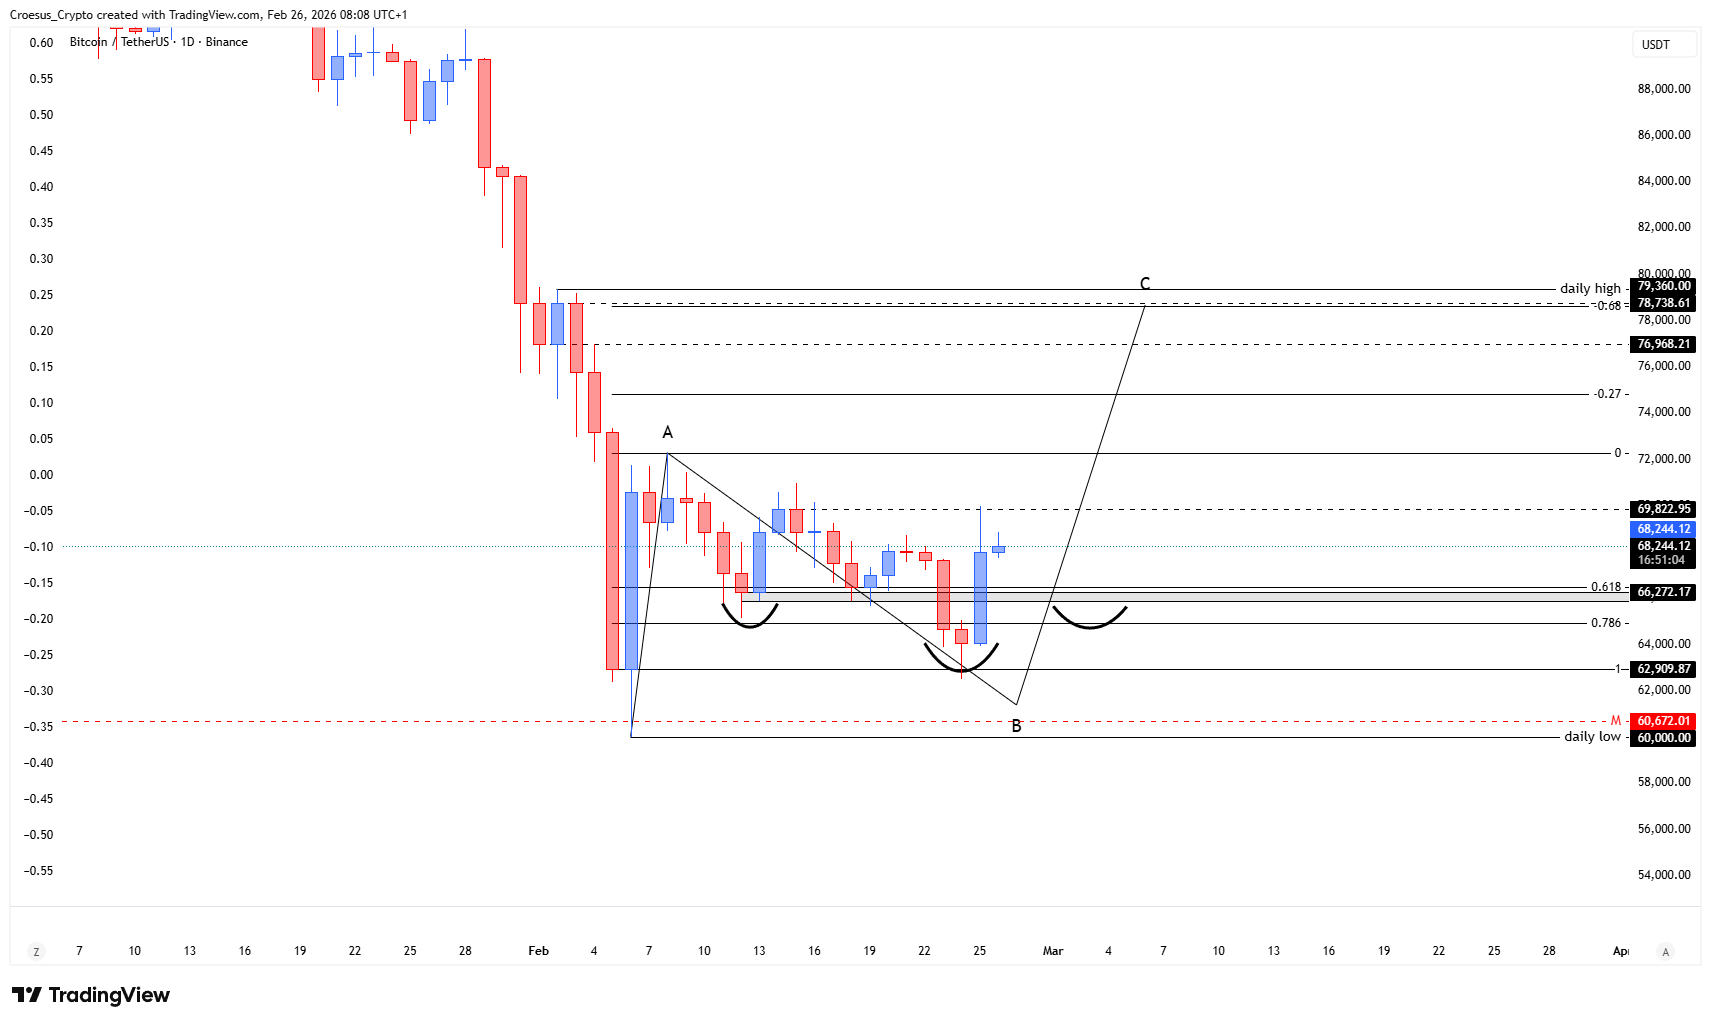
Market Structure Analysis
This BTC daily analysis focuses on a developing inverse head and shoulders, where the “first retest” defines the shoulder level and the “second retest” defines the head.
Structurally, the key tell is how price reacts after tagging the neckline: a clean impulsive continuation would signal buyers taking control and can translate into a local break of structure. If price instead pulls back, the market can still be building the right shoulder (a controlled corrective structure), or it can retrace deeper back into the head area, shifting the idea toward a double bottom.
The liquidity detail matters here: with the head swing low around $62,900 and a prior swing low near $60,000, stops clustered below the head form an obvious liquidity pool that can be swept before any sustained continuation.
Key Levels and Scenarios
For bullish continuation, price needs to hold above the shoulder area and convert the neckline zone from resistance into support after the initial hit. Bearishly, any failure at the neckline followed by a sweep below the $62,900 head level keeps the move in a corrective context and can target the deeper swing-low liquidity.
- Neckline zone (recently hit): decision area for continuation vs rejection
- $62,900 (head swing low): key liquidity level and nearby invalidation for the iHS idea
- Shoulder level (first retest): support zone to defend for a right-shoulder formation
- $60,000 (prior swing low): lower liquidity magnet if the head breaks
Trading Implications
BTC daily analysis remains tactical here: aggressive participants typically look for confirmation around the neckline and manage risk around the head/shoulder structure, while conservative traders often wait for a clearer break of structure and a support/resistance flip. With liquidity sitting below the head, choppy pullbacks are still structurally “allowed” before direction resolves.
This analysis is for informational purposes only and does not constitute financial advice.