


In this BTC daily analysis for late November 2025 we track a corrective bounce forming after a strong bearish leg down. Our technical analysis focuses on the potential ABC structure, key support resistance zones and Fibonacci confluence that could cap the current move.
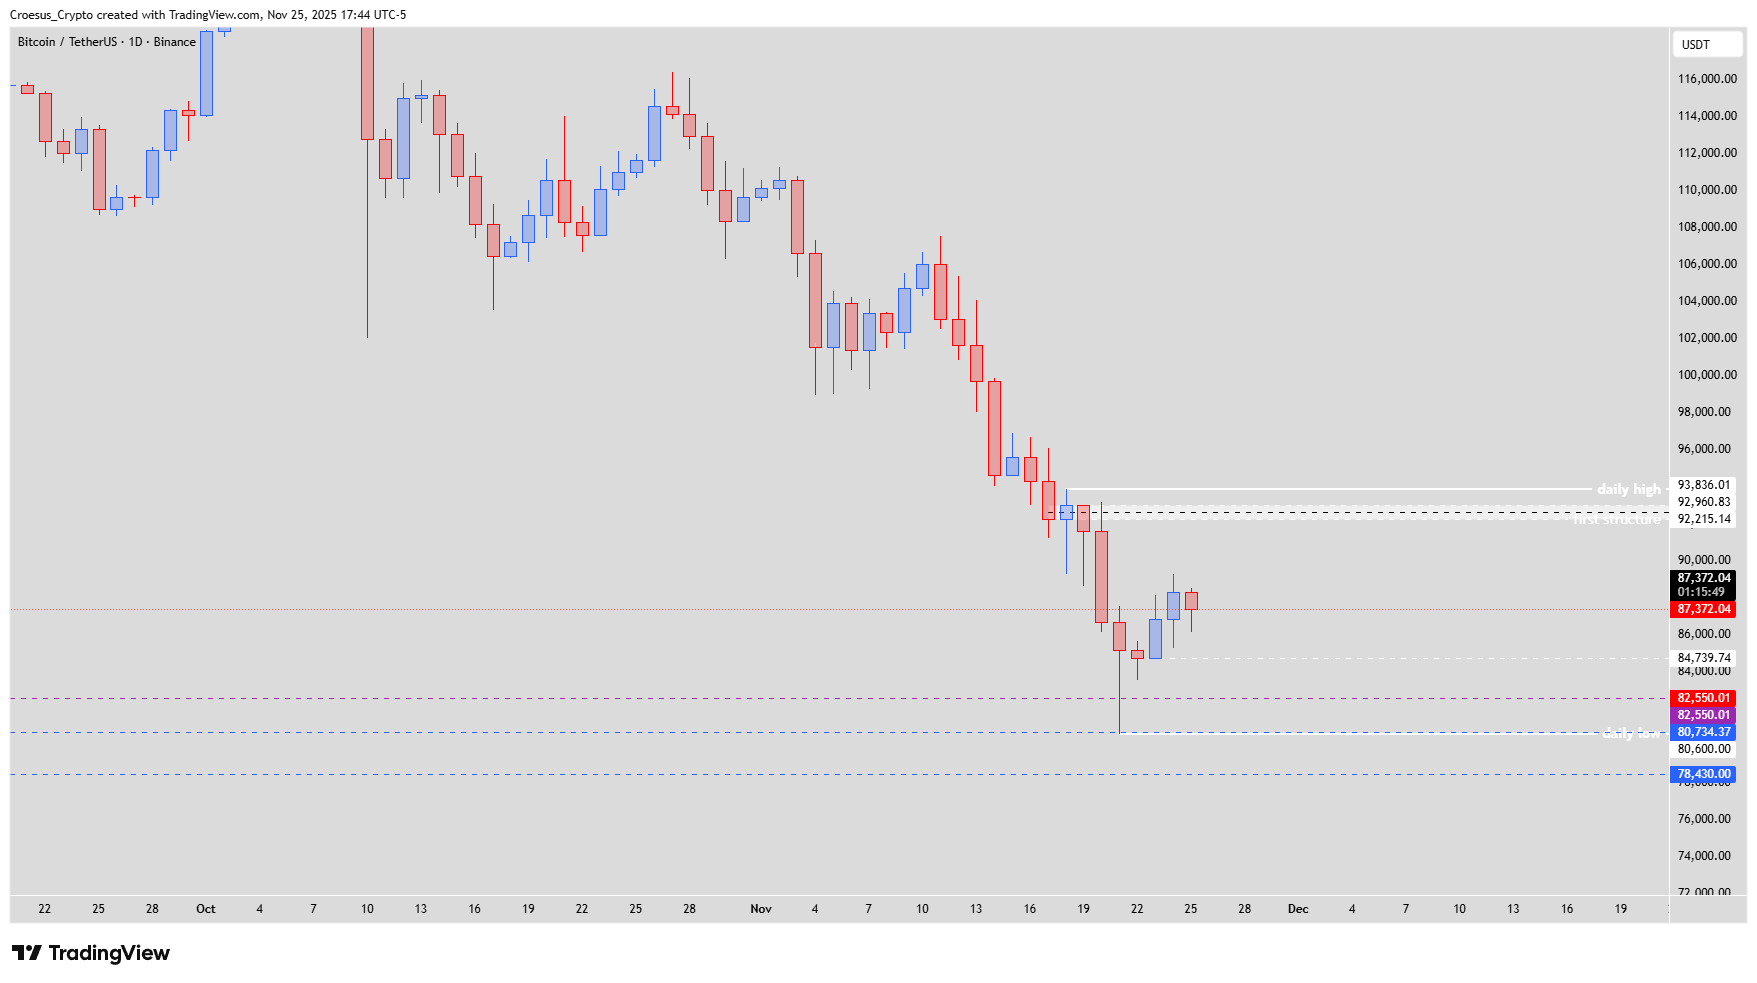
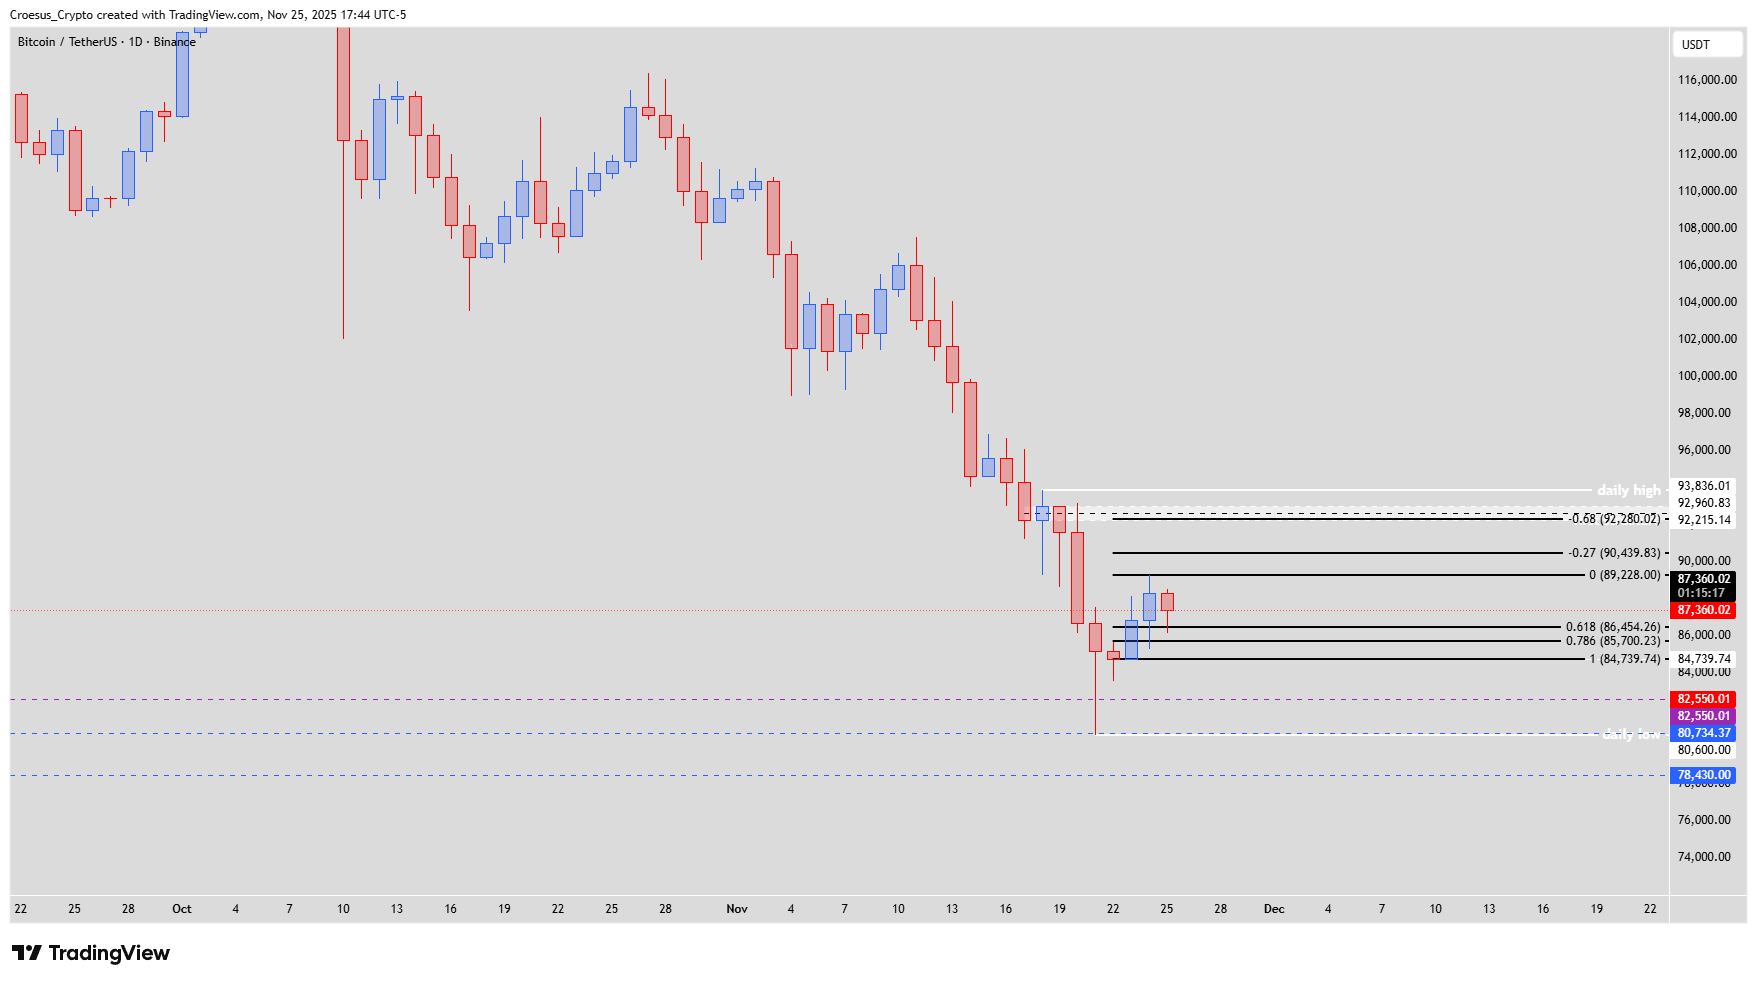
BTC daily chart 25 Nov 2025 with Fibonacci retracement, ABC correction and daily entry zone confluence.
Trend = bearish ↓
Technical Analysis Key Points
- Today price printed a bearish candle after two bullish candle, which could indicate a ABC correction of the bearish leg down
- If we take the fib retracement of the last bullish corrective leg, we can see that the fib level -0.68 is confluent with the daily entry zone.
- Eventhough price hit some key supportlevels and shows some bullish relief, there is still a bearish bias. To get a bullish bias price needs to break the daily high and defend this level @ 93,836.01 $
- As long as there is no bullish reversal, we need to treat this bullish move as a correction of the last bearish leg down. Price could react bearish when hitting the 92,215 $ level.
Market Structure Analysis
The current BTC daily analysis views the recent two-candle bounce as an internal correction within the prevailing downtrend. Today’s bearish candle after two bullish ones fits the idea of an emerging ABC corrective pattern, where the latest leg stalls into the daily entry zone. The fact that this area aligns with the -0.68 Fibonacci extension of the prior bullish corrective swing strengthens its role as potential supply in our support resistance map.
Despite price responding from lower support levels, the structure still prints lower lows and lower highs. Until BTC breaks the daily high at 93,836.01 $ and then defends it on a closing basis, we categorise this move as corrective rather than the start of a new impulsive uptrend.
Key Levels and Scenarios
A short-term bullish scenario would require price to reclaim 93,836.01 $ with conviction, turning that daily high into support and invalidating the immediate bearish bias. Without that, our base case remains a corrective rally into resistance followed by renewed downside pressure.
Key levels to watch:
93,836.01 $ – Daily high: must be broken and held to shift to a bullish bias.
92,215 $ – Reaction zone: area where price could react bearish within the ABC correction.
Daily entry zone – Fib -0.68 confluence: main resistance cluster for fresh short opportunities.
Key support band below recent low: zone where prior selling climax found buyers and where bears may take profit.
Trading Implications
Within this BTC daily analysis, traders may prefer to frame the current move as a bearish corrective rally, look for rejection signals around the daily entry zone / 92,215 $ area, and use 93,836.01 $ as a clear invalidation level while adjusting position size to individual risk tolerance.
This content is for educational purposes only and is not financial advice; always do your own research before making any investment or trading decisions.