


BTC Marketcap / Bitcoin
BTC daily analysis 26/02/2026. Bitcoin is currently pausing after a strong impulsive push, with price compressing into a short-term consolidation while the broader trend context remains bearish. This BTC daily analysis focuses on whether this pause resolves into continuation or if the market uses the structure to trap late participants.
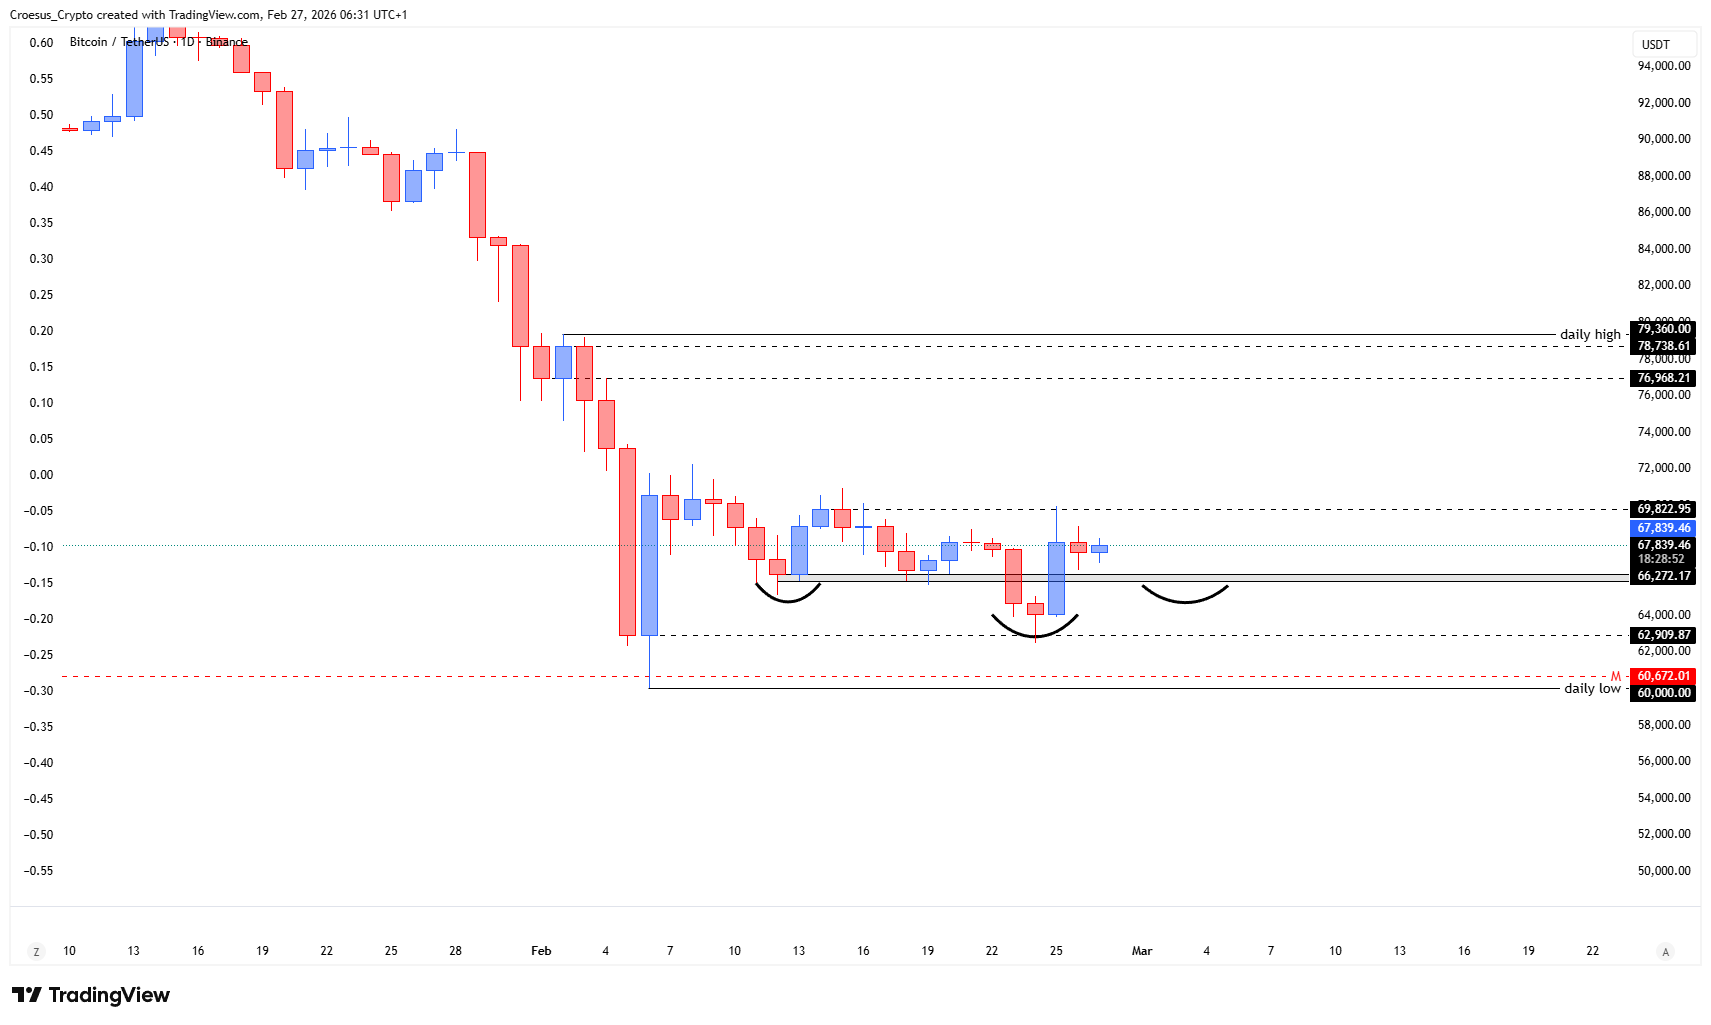
- BTC shows us a consolidation day after an impulsive move up.
- The inverse head and shoulders pattern remains valid.
Market Structure Analysis
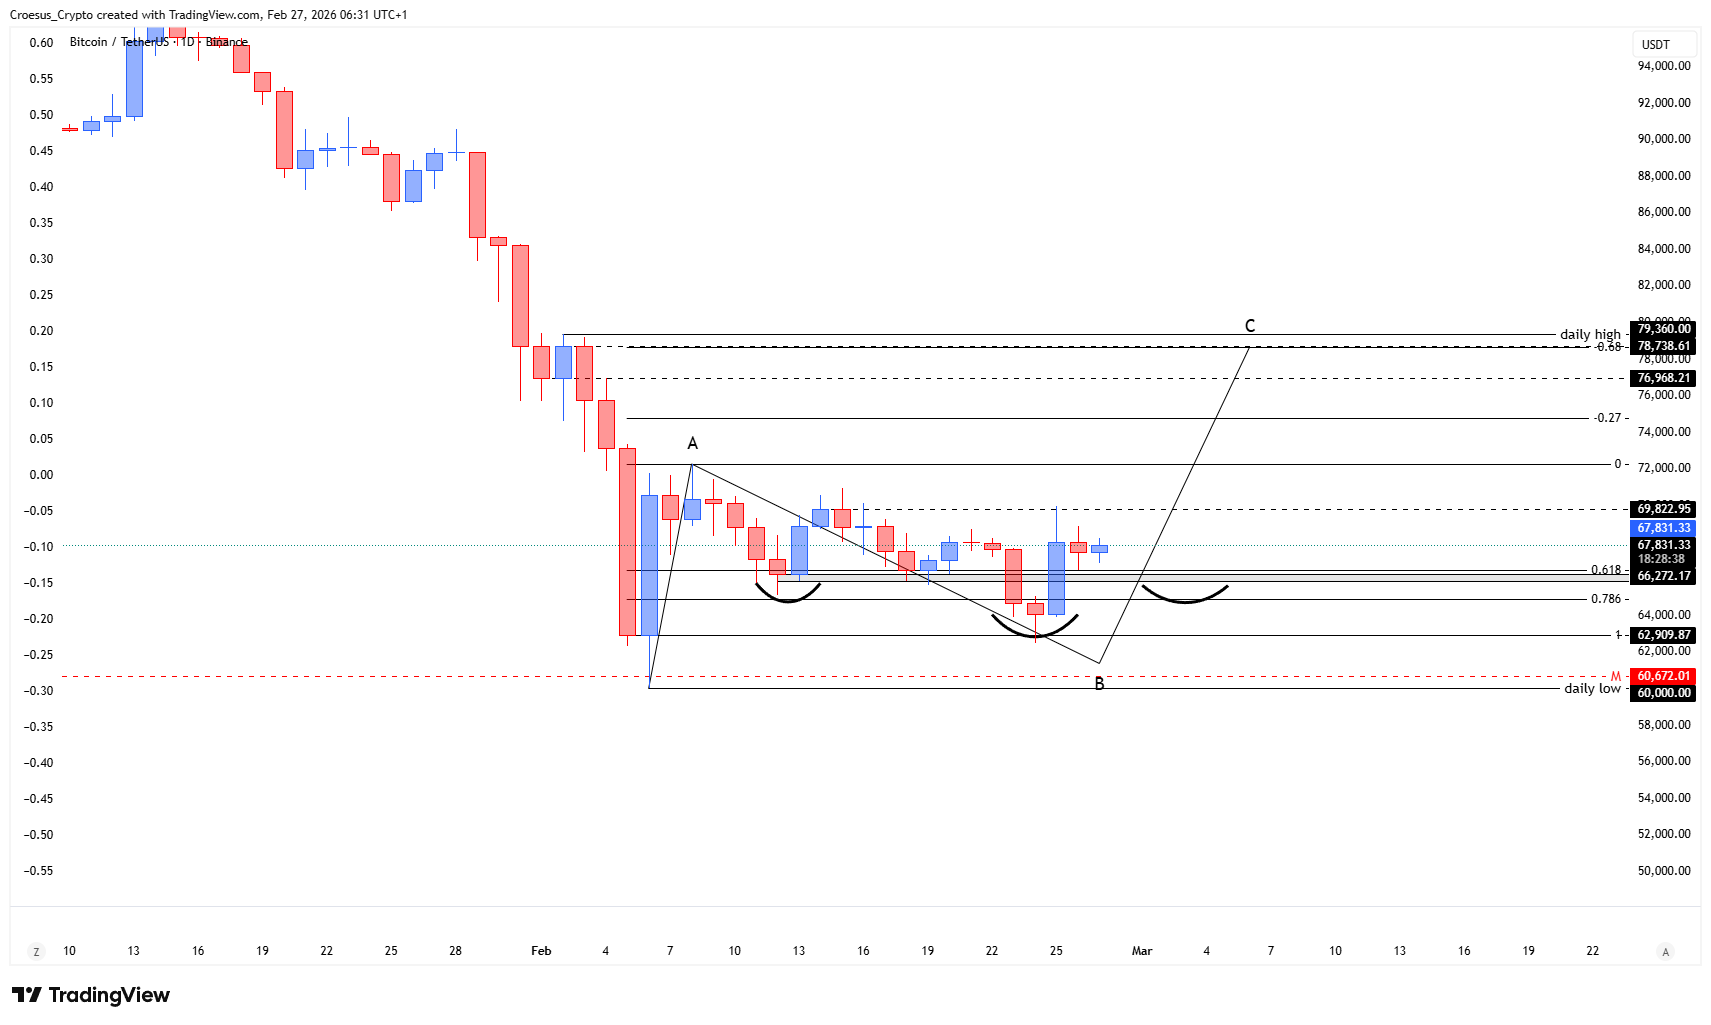
From a market structure perspective, the impulsive move up followed by a consolidation day signals a shift from expansion to compression, where liquidity builds on both sides of the short-term range. In a bearish environment, this often becomes a decision zone: either the move up develops into a broader corrective structure, or it becomes a short-lived relief push that gets sold into.
The fact that the inverse head and shoulders pattern “remains valid” keeps a bullish reversal pathway open, but validity alone is not confirmation—structure still needs continuation through overhead resistance and acceptance above the neckline area. Until that happens, the consolidation can act as a platform for a sweep of range extremes (liquidity grab) before the next impulsive leg.
Key Levels and Scenarios
In this BTC daily analysis, the key is how price resolves the consolidation relative to the inverse head and shoulders structure. A bullish resolution requires a clean break and hold above the consolidation high and continued acceptance beyond the neckline area. A bearish resolution is signaled by rejection from resistance and breakdown through the consolidation low, placing the recent impulsive move in context as a corrective retracement within the dominant downtrend.
- Consolidation high (short-term resistance): bullish continuation trigger if broken and held
- Consolidation low (short-term support): loss of this level shifts momentum back to sellers
- Inverse head and shoulders neckline area: acceptance above it strengthens reversal odds
- Recent swing low within the structure: structural invalidation zone if reclaimed by bears
Trading Implications
Aggressive traders typically focus on the range resolution, while conservative traders wait for confirmation through a break-and-retest around the neckline/structure. With bearish trend conditions, risk control is centered on avoiding chop inside the consolidation and respecting that failed breakouts are common around major reversal patterns.
This analysis is for informational purposes only and does not constitute financial advice.