


BTC Marketcap / Bitcoin
BTC daily analysis 26 January 2026. Bitcoin is still trending bearish on the daily timeframe, and our technical analysis stays focused on downside continuation unless the current reclaim develops into a stronger structural shift.
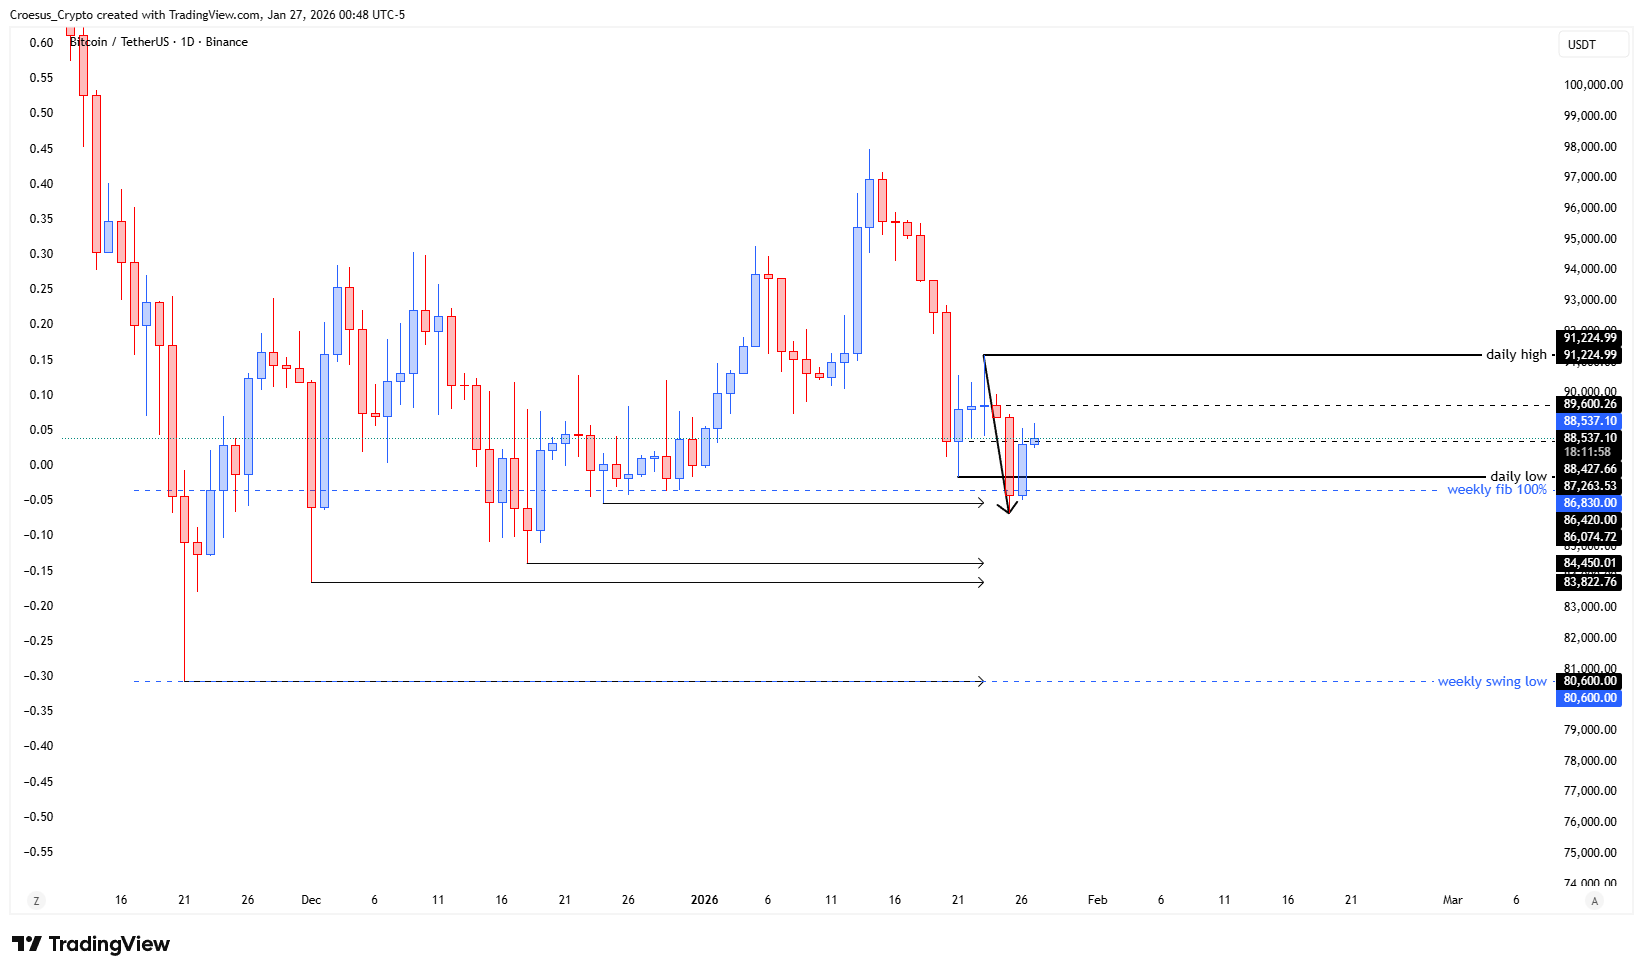
- Same here as with the TOTAL daily analysis : new drop on Sunday and reclaim on Monday, taking away the liquidity below the first untested low.
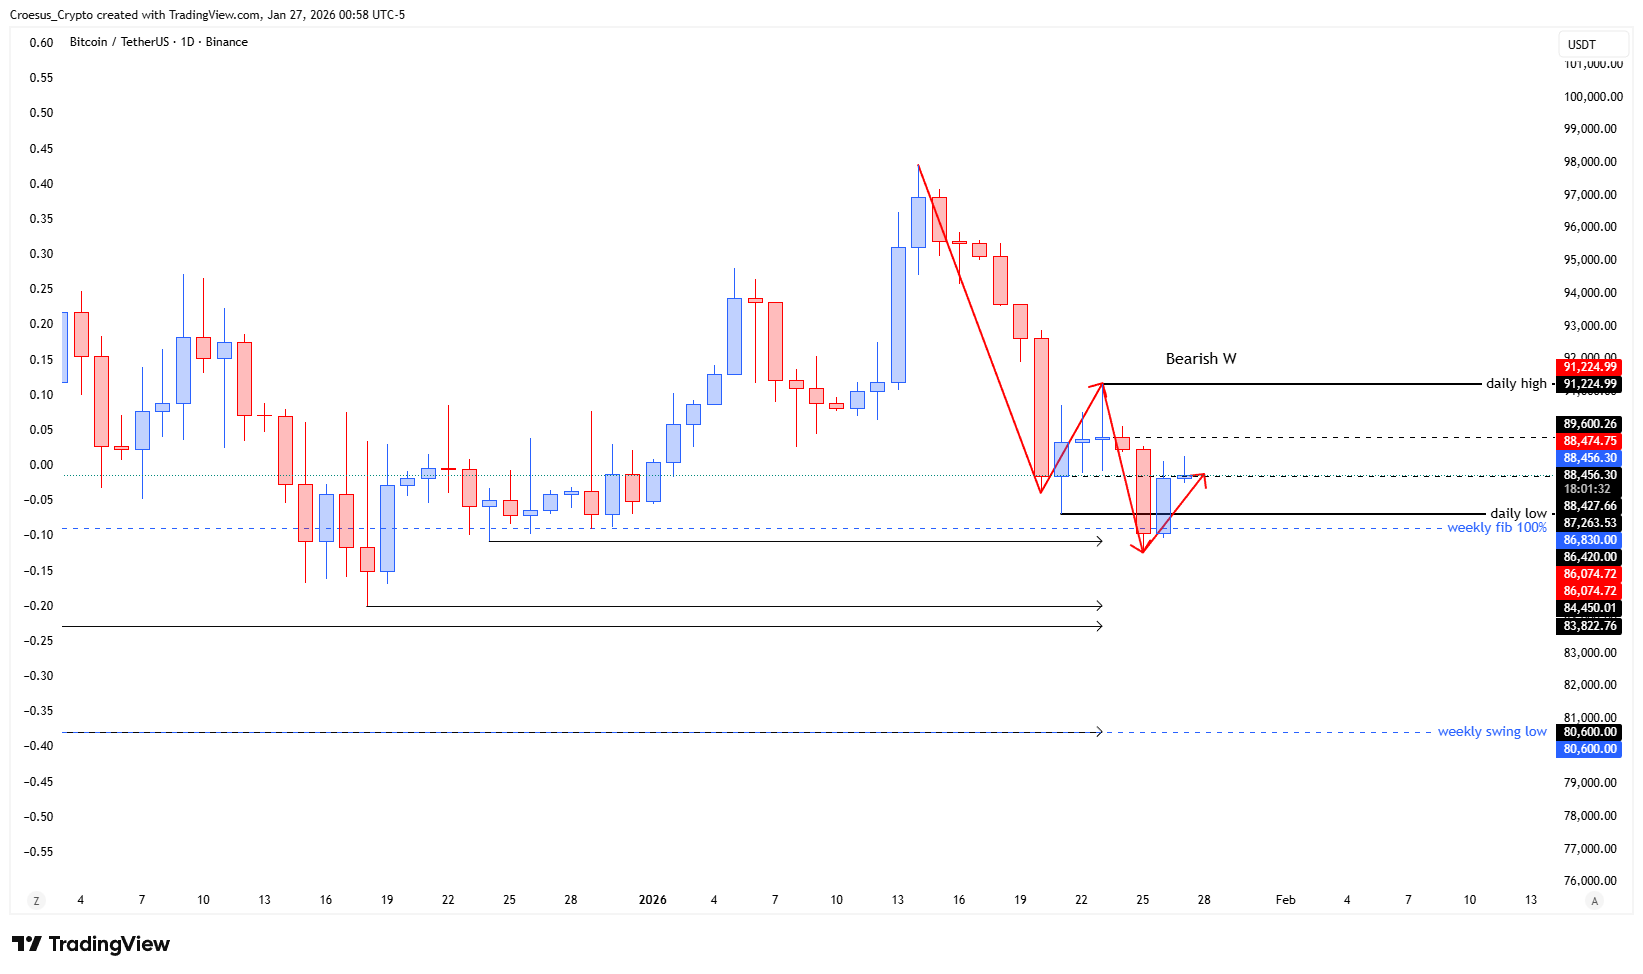
- As the price is still trending bearish, we still have to look for bearish set-ups rather than bullish. At this moment we can see a bearish W developing. At this moment we hit the first structure and the golden pocket of retracement. So we could expect some bearish reaction. If the bearish W plays out until the fib level -0.68, we can see the next prior lows being swept.
Market Structure Analysis
The Sunday sell-off followed by a Monday reclaim reads as a classic liquidity event: price ran stops below the “first untested low,” then rotated back into the prior range. In a bearish daily context, that reclaim is not automatically bullish—often it becomes a corrective leg back into overhead support resistance before the next impulsive move resumes downside. With price now reacting at the “first structure” and the “golden pocket of retracement,” our BTC daily analysis treats this area as a decision zone: acceptance above would suggest the correction is extending, while rejection keeps the bearish market structure intact and aligns with the “bearish W” development described in the notes. The key is whether this retracement is just a pullback into supply, or the start of a meaningful break of structure (not confirmed in the draft).
Key Levels and Scenarios
In this BTC daily analysis, the primary bearish scenario is a rejection from the golden pocket/first-structure confluence, followed by continuation into liquidity resting at prior lows. A more constructive outcome requires price to hold reclaimed structure and negate the bearish reaction at this retracement area; without that, Fibonacci-driven downside expansion toward the noted -0.68 level remains the active roadmap.
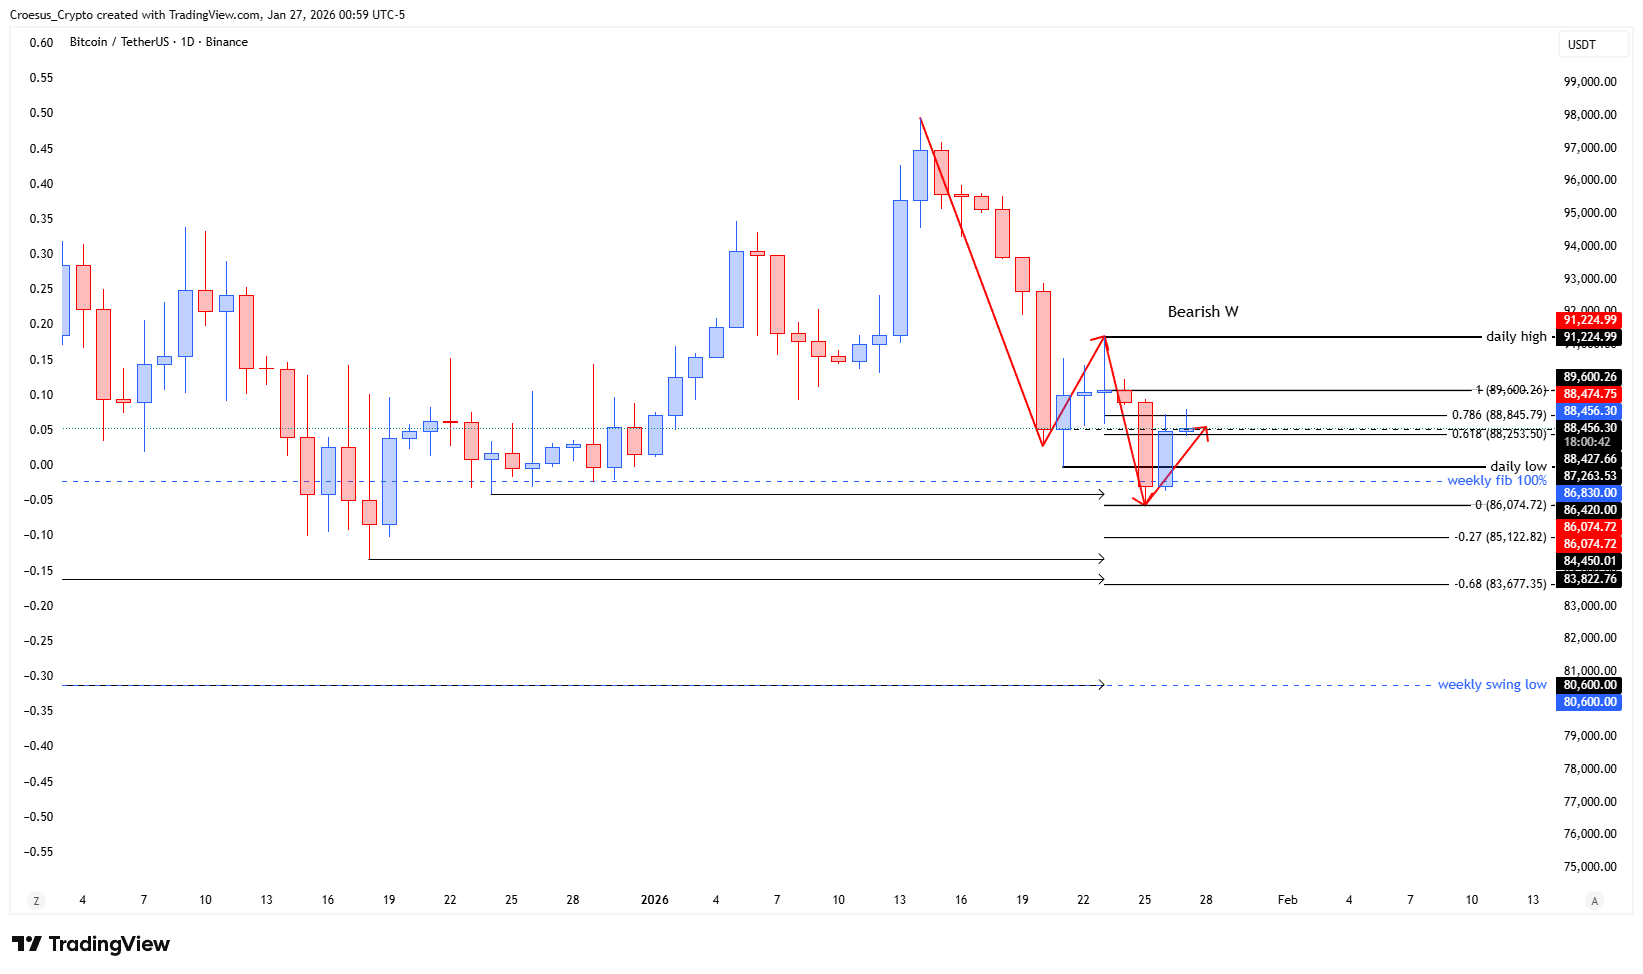
- The first untested low (liquidity taken) as a reference for whether the reclaim holds
- The first structure as the immediate reaction/invalidation area for a bearish rejection
- The golden pocket of retracement as the key Fibonacci-based resistance zone in the pullback
- The fib level -0.68 as the downside expansion level if the bearish W plays out
- The next prior lows as the likely liquidity target zone on continuation
Trading Implications
With the daily trend still bearish, our framework favors patience around the retracement zone: aggressive participants often look for confirmation of rejection at resistance, while conservative participants typically wait for continuation signals and clean market structure alignment. Risk remains elevated if price chops through the first structure, as that would reduce clarity around near-term direction.
This analysis is for informational purposes only and does not constitute financial advice.