


In this Bitcoin daily analysis for late November 2025, we track a corrective bounce inside a broader bearish trend. Our technical analysis focuses on clean price action, Fibonacci extensions and clear support resistance zones to define the next high-probability areas of interest for BTC.
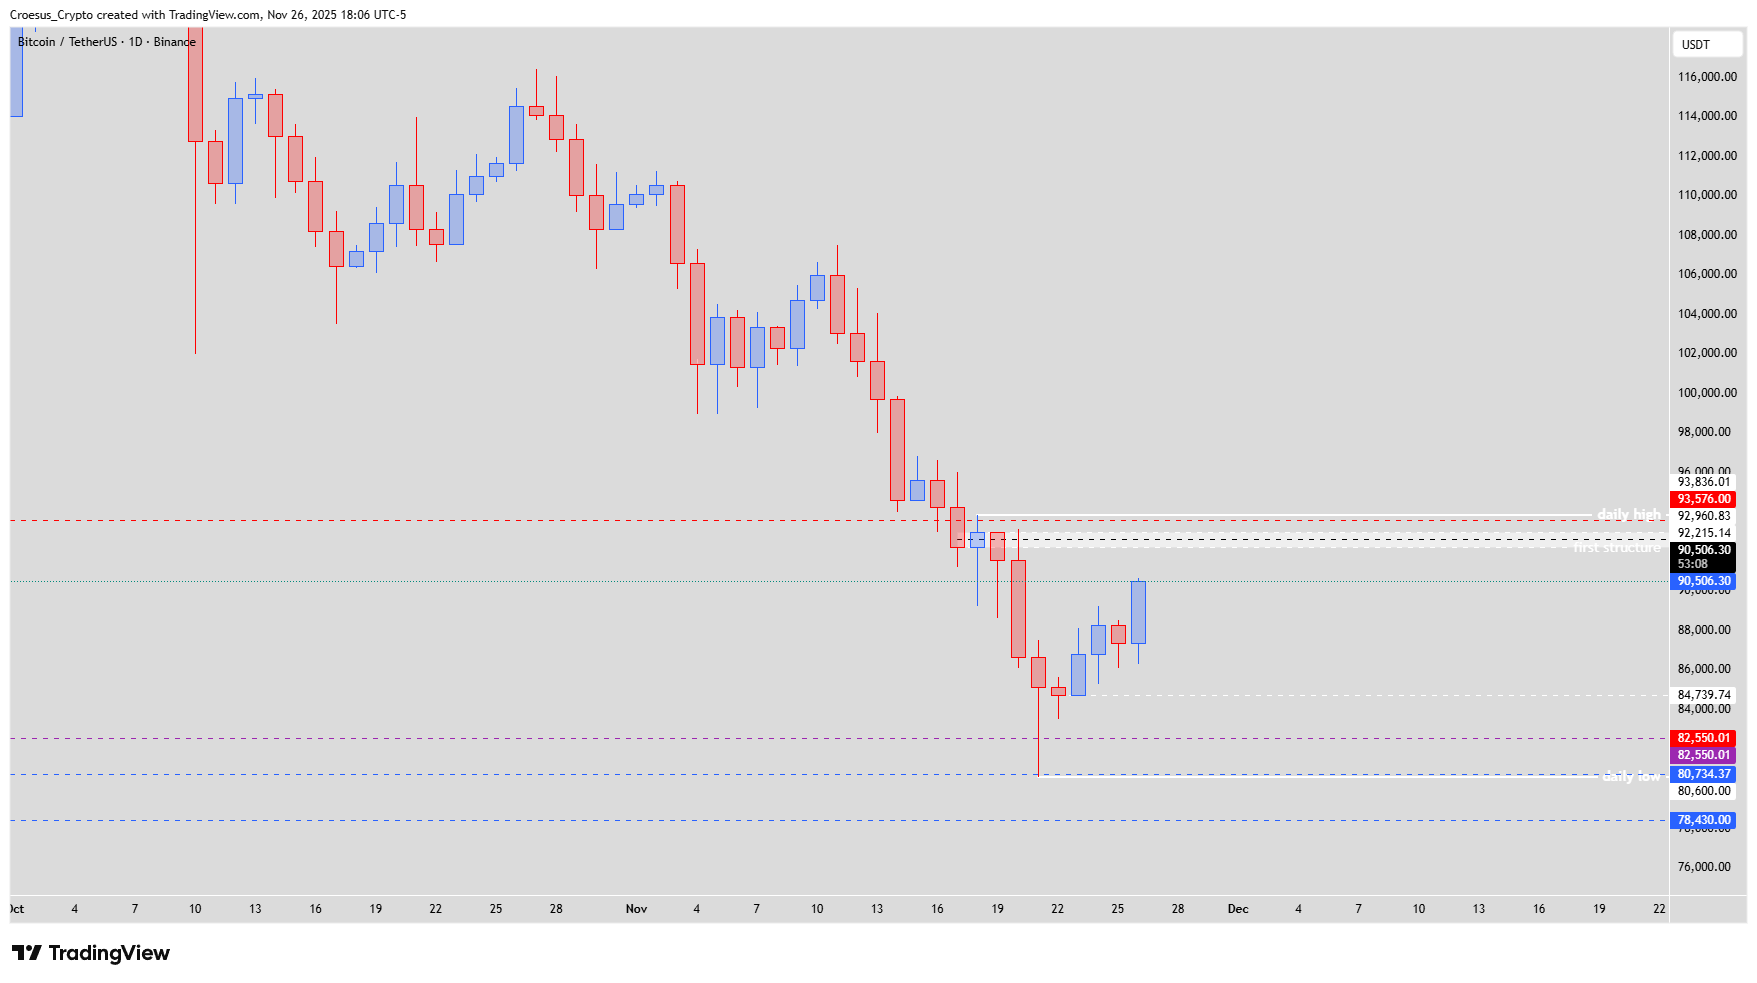
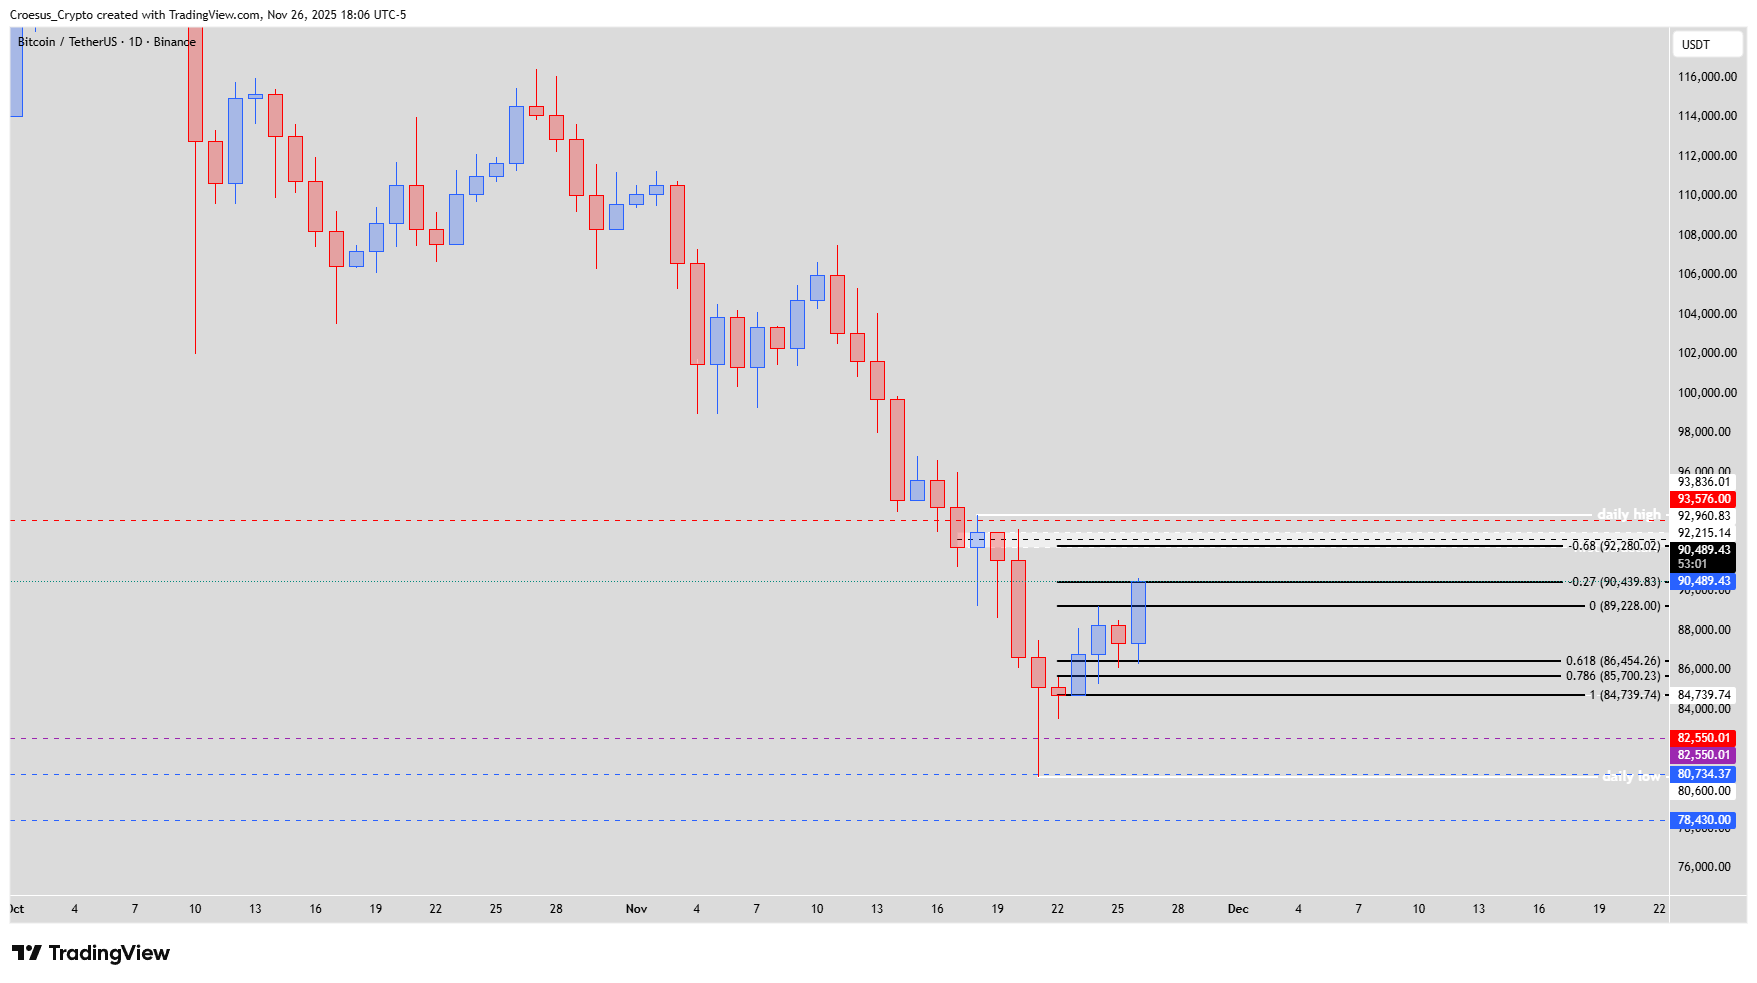
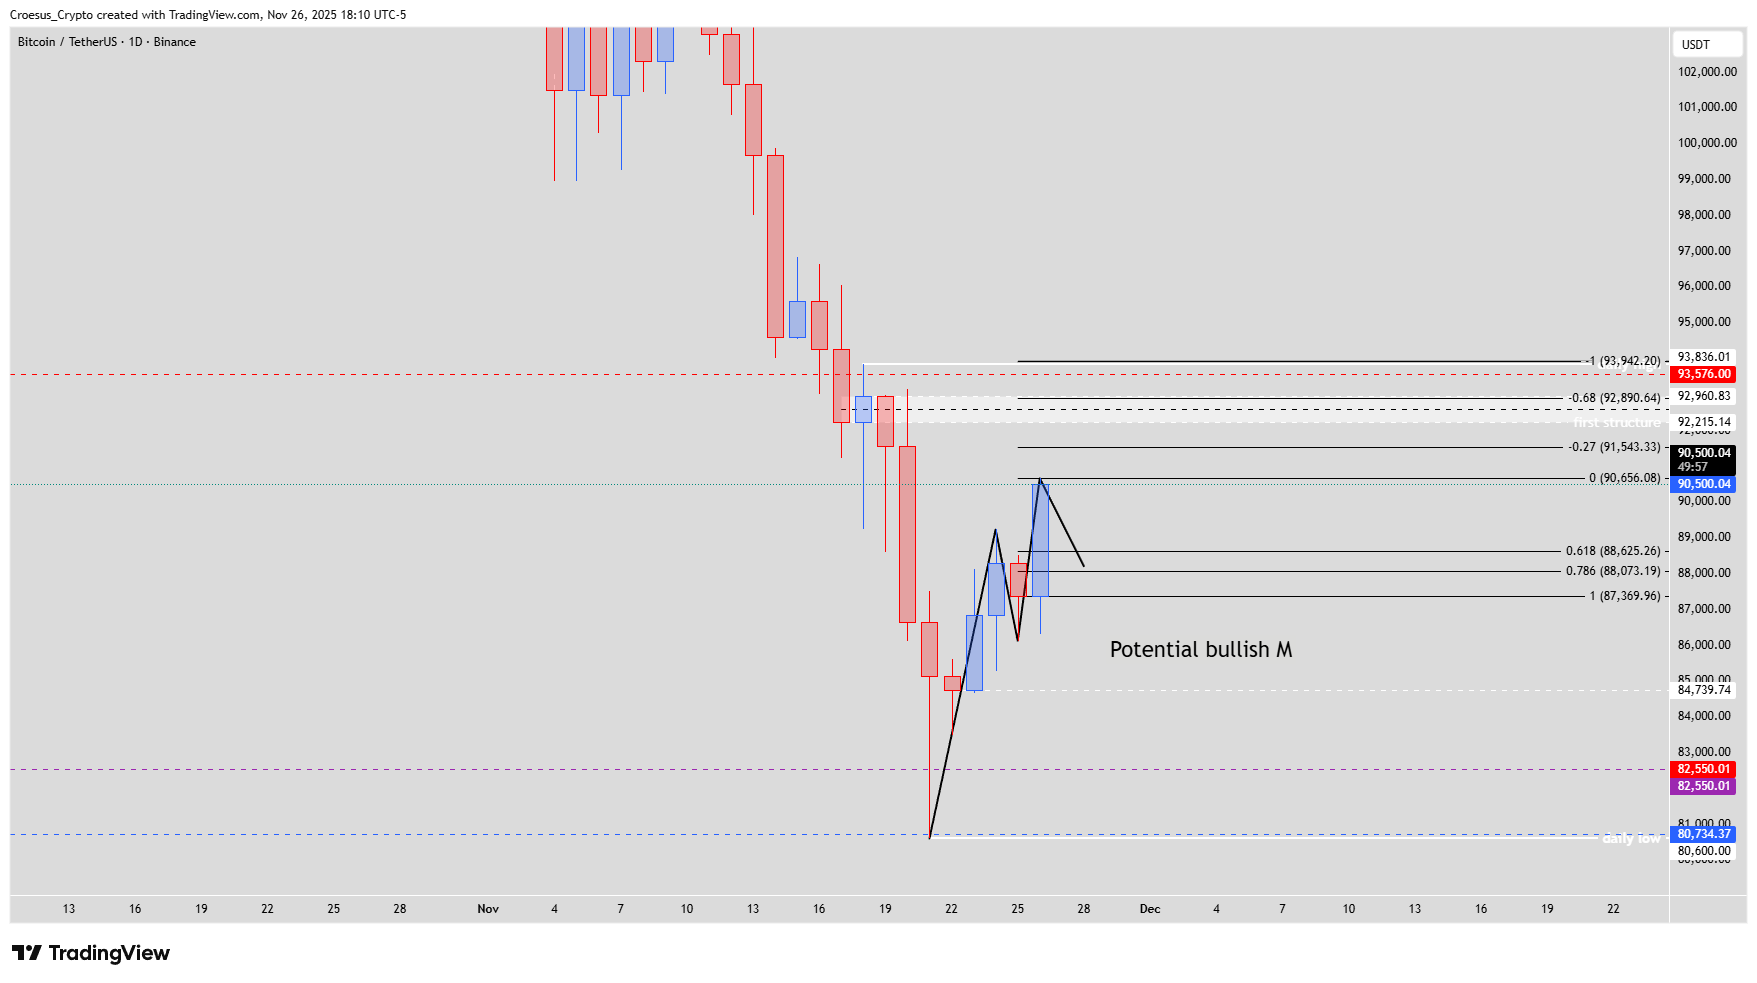
Bitcoin daily chart 26 November 2025 showing potential bullish M pattern and Fibonacci levels into 92K–93K resistance zone.
Trend = bearish ↓
Technical Analysis Key Points
- After a slight pullback yesterday, touching the fib level 0.618, we could see the price rise again today hitting the -0.27.
- We could see the development of a bullish M, which would fit in the corrective move towards the daily entry zone around 92K-93K.
- If we take the fib retracement of the last bullish corrective leg, we can see that the fib level -0.68 is confluent with the daily entry zone.
- Eventhough price hit some key supportlevels and shows some bullish relief, there is still a bearish bias. To get a bullish bias price needs to break the daily high and defend this level @ 93,836.01 $
- As long as there is no bullish reversal, we need to treat this bullish move as a correction of the last bearish leg down. Price could react bearish when hitting the 92,215 $ level.
Market Structure Analysis
This Bitcoin daily analysis shows BTC retracing the last impulsive selloff, with buyers stepping in at the 0.618 Fibonacci retracement and pushing price up into the -0.27 extension. The developing bullish M formation fits the idea of a corrective structure rather than a confirmed reversal. The 92K–93K daily entry zone is reinforced by the -0.68 Fibonacci level from the most recent bullish leg, creating a strong confluence area where we expect increased order flow. Until the daily high at 93,836.01 $ is broken and defended, our technical analysis keeps the broader structure bearish, treating current strength as a counter-trend rally within the existing downtrend.
Key Levels and Scenarios
Bullish scenario: for a sustained reversal, bulls need a clean breakout and daily close above 93,836.01 $, followed by successful retests of this level as support; only then would the bias shift from corrective to trending higher in future Bitcoin daily analysis.
Key levels to watch:
93,836.01 $ – daily high; must break and hold for a confirmed bullish bias.
92K–93K – daily entry zone aligned with -0.68 Fibonacci; potential exhaustion area for the bounce.
92,215 $ – intermediate resistance where price could react bearish within the corrective move.
0.618 retracement zone – previous reaction area that started the current push up.
Trading Implications
With support holding but structure still bearish, our technical analysis favors treating rallies into 92K–93K as potential short zones with tight invalidation above 93,836.01 $, while conservative traders may wait for clearer confirmation of either rejection or breakout before positioning.
This content is for educational purposes only and is not financial advice; always do your own research before making any investment or trading decisions.