


BTC Marketcap / Bitcoin
BTC daily analysis 27 January 2026. Bitcoin is still trading inside a bearish structure after a recent correction, and our technical analysis remains focused on whether price can take remaining liquidity at the retracement zone without breaking daily structure.
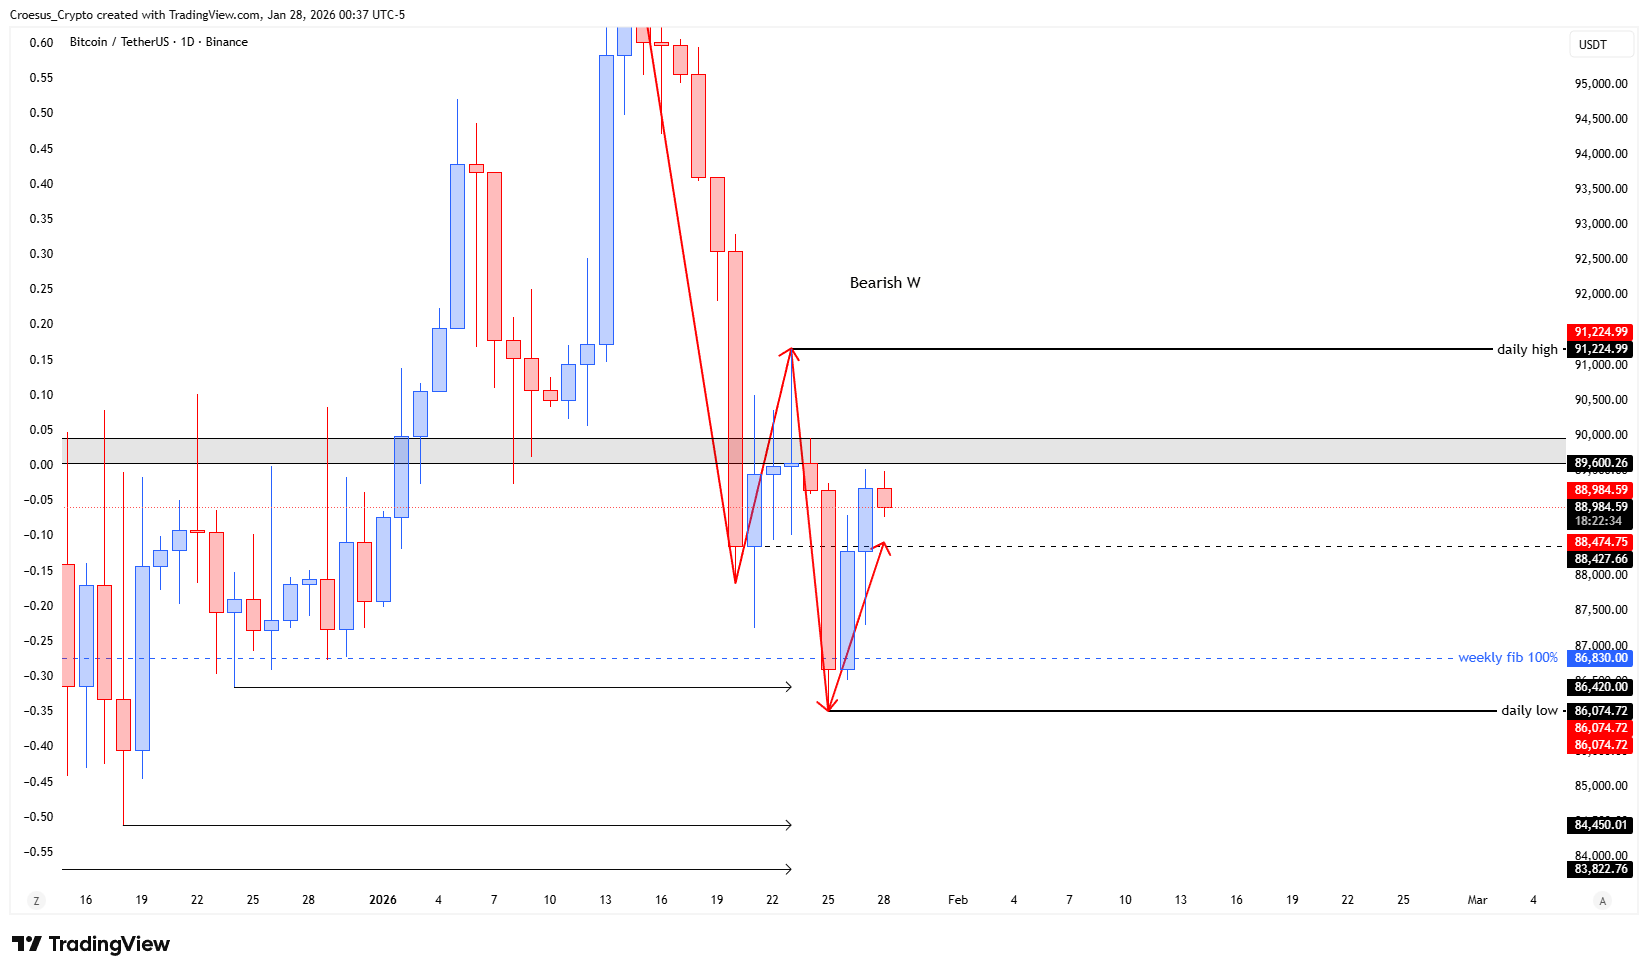
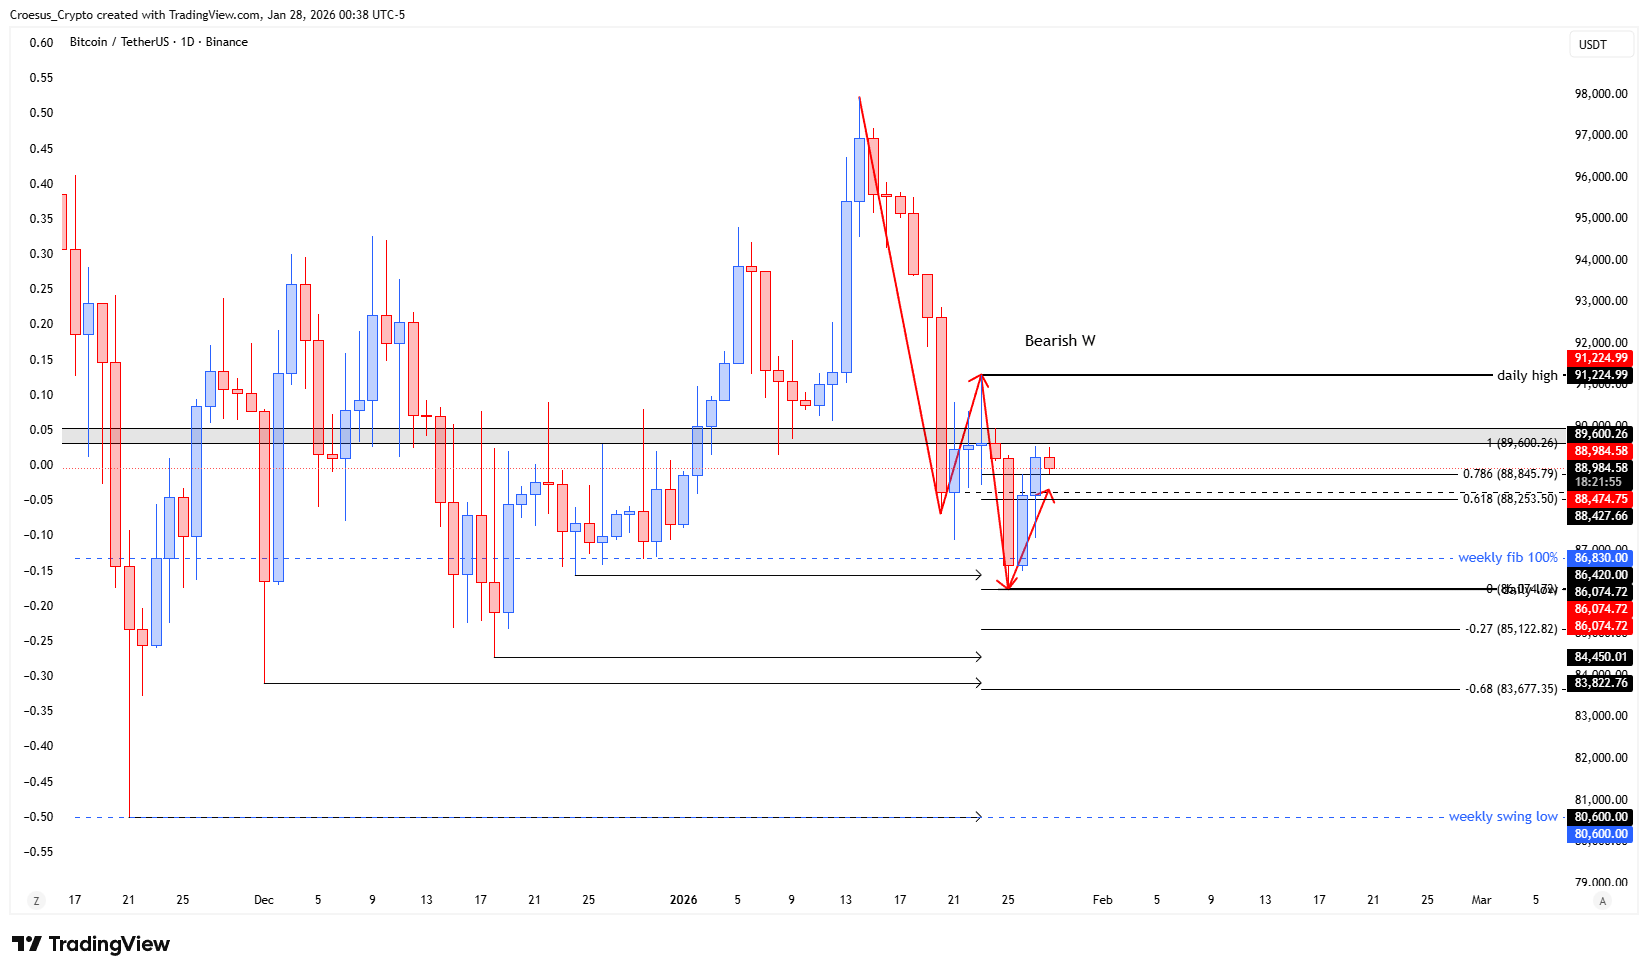
- Same here as with the TOTAL daily analysis : only difference is that the 100% retracement hasn't been touched yet. This could entice early shorters to open a position already and get stopped out if the 100% still gets hit.
- At this moment there are no indications that this recent correction acts as a decisive change of trend. Neither the daily high nor the daily low have been broken so the trend remains bearish and the bearish W remains active.
Market Structure Analysis
This BTC daily analysis continues to read as bearish because the defining daily swing points are intact: price has not broken the daily high (no bullish break of structure) and has not broken the daily low (no bearish expansion confirming a fresh impulse). The current move is best treated as a corrective structure within a larger bearish context, where traders often see a late “magnet” toward the 100% retracement (a key Fibonacci reference). If that 100% level is still untapped, it can act as a liquidity zone that invites early shorts to enter before the market completes its sweep, creating the stop-out risk described in the observations. The “bearish W” remaining active implies the market is still respecting its prior distribution-style structure, so support resistance mapping should stay anchored to the most recent daily swing high/low rather than assuming a trend reversal from a single correction.
Key Levels and Scenarios
Bearish continuation remains the base case unless BTC prints a clear daily break of structure to the upside. A sweep into the 100% retracement zone without reclaiming key resistance can still resolve lower, while a decisive reclaim and hold above the daily swing high would be the first structural sign the correction is evolving into a reversal.
- 100% retracement level (Fibonacci) as the remaining liquidity/sweep zone
- Most recent daily swing high as primary resistance and bullish break-of-structure trigger
- Most recent daily swing low as primary support and bearish continuation trigger
- The active bearish W structure boundary as the key invalidation/confirmation area
Trading Implications
With structure still bearish, aggressive positioning tends to focus on fades into resistance and liquidity-sweep behavior, while conservative traders typically wait for confirmation via a daily break of structure or a clear rejection after the 100% retracement is resolved. Risk remains elevated while price is caught between unbroken swing levels.
This analysis is for informational purposes only and does not constitute financial advice.