


BTC Daily Analysis 27 Nov 2025 - Bearish Fib Correction Play
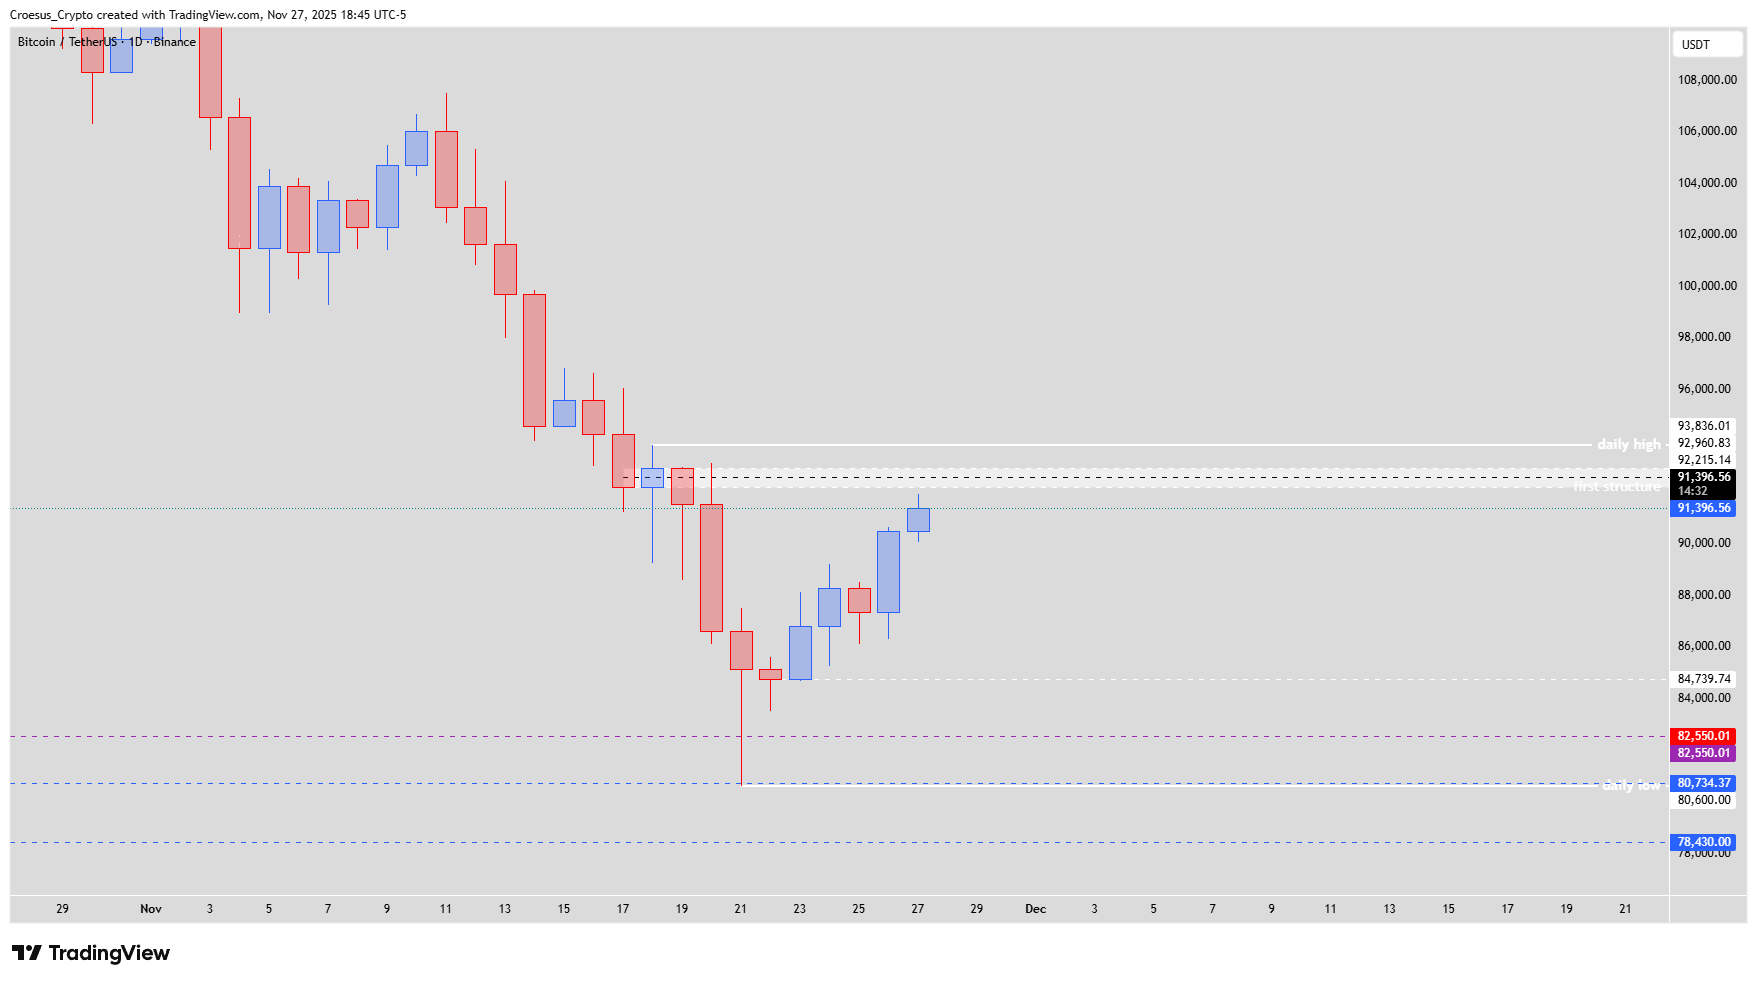
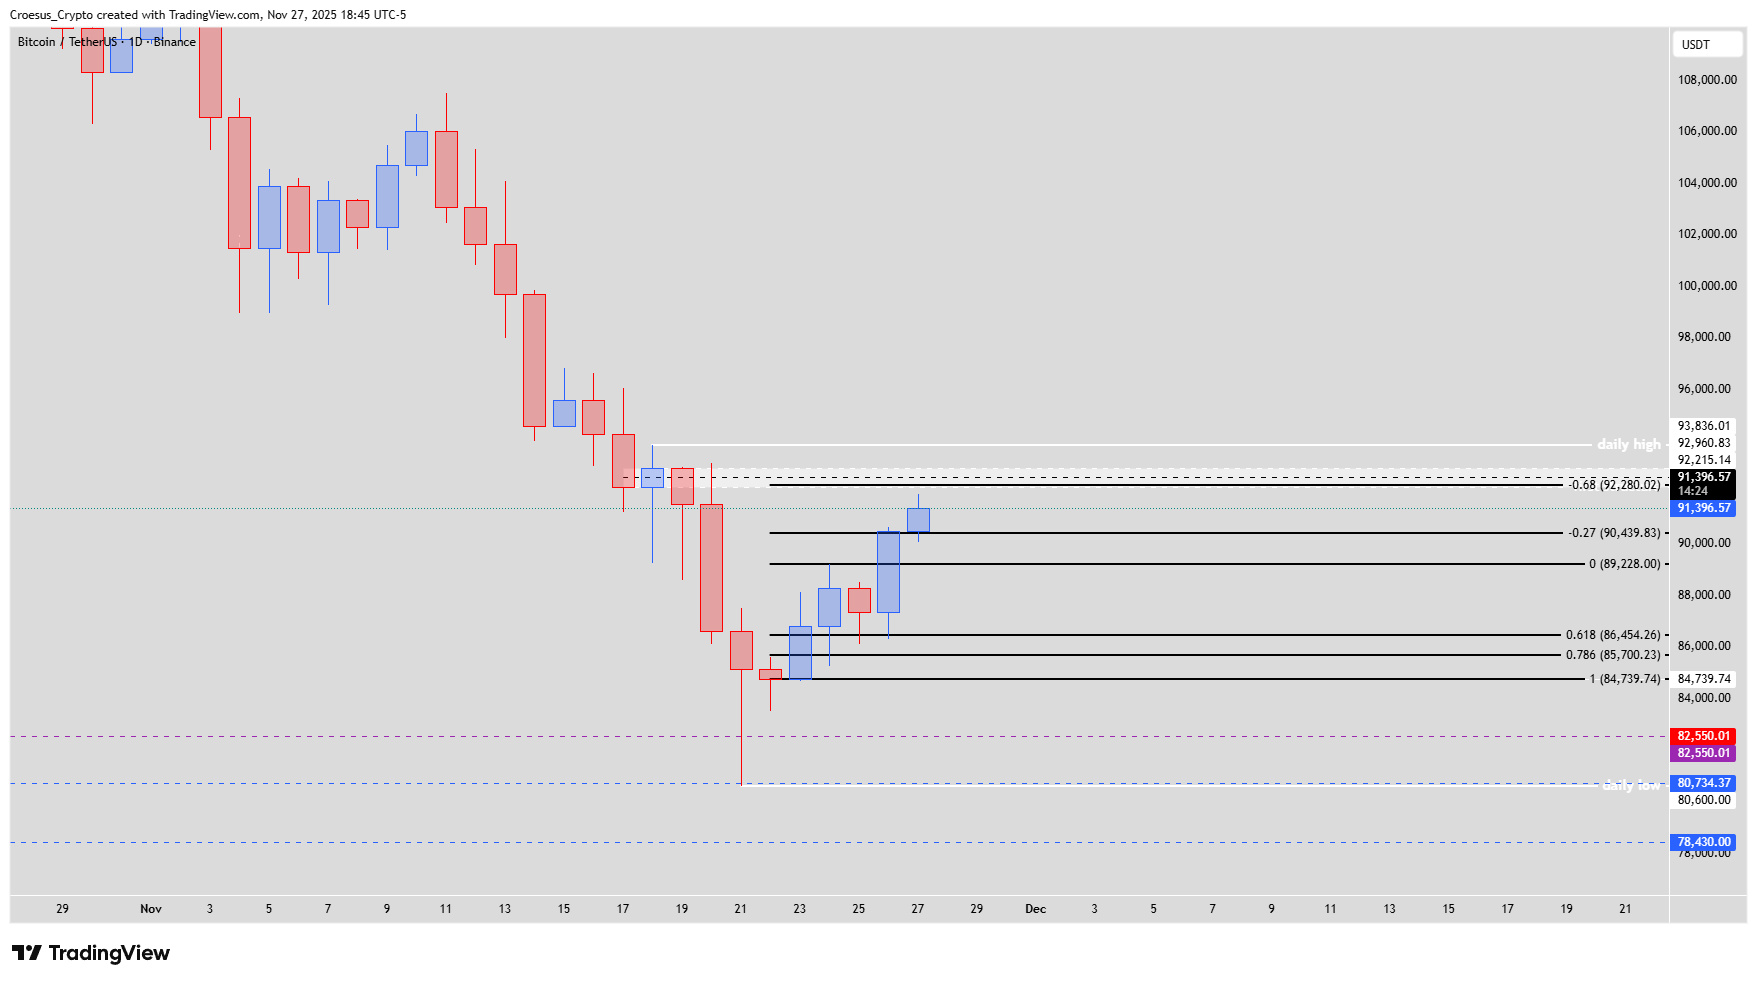
BTC daily analysis shows a corrective bounce above the -0.27 Fibonacci, with bearish bias intact while price holds below 93,836 $ and reacts near 92,215 $.
Trend = bearish ↓
Technical Analysis Key Points
- BTC continued higher past the -0.27 but did not touch the -0.68 and/or the daily entry zone yet
- We wait until the price touches the daily entry zone before we look for reversal patterns on the 4H entry zone
- Eventhough price hit some key supportlevels and shows some bullish relief, there is still a bearish bias. To get a bullish bias price needs to break the daily high and defend this level @ 93,836.01 $
- As long as there is no bullish reversal, we need to treat this bullish move as a correction of the last bearish leg down. Price could react bearish when hitting the 92,215 $ level.
Market Structure Analysis
From a market-structure perspective, this BTC daily analysis frames the current move as an ABC-style correction into overhead resistance. Price already pushed beyond the -0.27 Fibonacci extension but has not yet completed a full test of the daily entry zone or the -0.68 level, which keeps room for one more push higher before a potential reversal. Despite bullish relief off key support, Bitcoin still trades below the reclaimed daily high, so the dominant leg remains the prior bearish impulse. Unless buyers can break and defend 93,836.01 $, this rally is more likely a corrective retrace than the start of a new trend.
Key Levels and Scenarios
ullish scenario: only a clean break and successful retest of the daily high at 93,836.01 $ would flip our bias, opening scope for higher targets beyond the current corrective structure in this support resistance zone.
Key levels to watch:
93,836.01 $ – daily high; must break and hold to confirm a bullish bias.
92,215 $ – resistance where price could react bearish within the correction.
Daily entry zone – area where we look for 4H reversal patterns.
-0.27 Fibonacci – already cleared; confirms the strength of the relief bounce.
-0.68 Fibonacci – potential completion level of the corrective structure before the next decision.
Trading Implications
For now we wait for price to tag the daily entry zone and print a clear 4H reversal before considering short setups, keeping risk tight above the daily high and sizing positions conservatively.
This content is for educational purposes only and is not financial advice; always do your own research before making any investment or trading decisions.