


BTC Marketcap / Bitcoin
BTC daily analysis 28 January 2026. Bitcoin is showing a sharp rejection from a previously respected daily entry zone, and our technical analysis now focuses on whether this rejection develops into a larger bearish continuation or resolves into a choppy range.
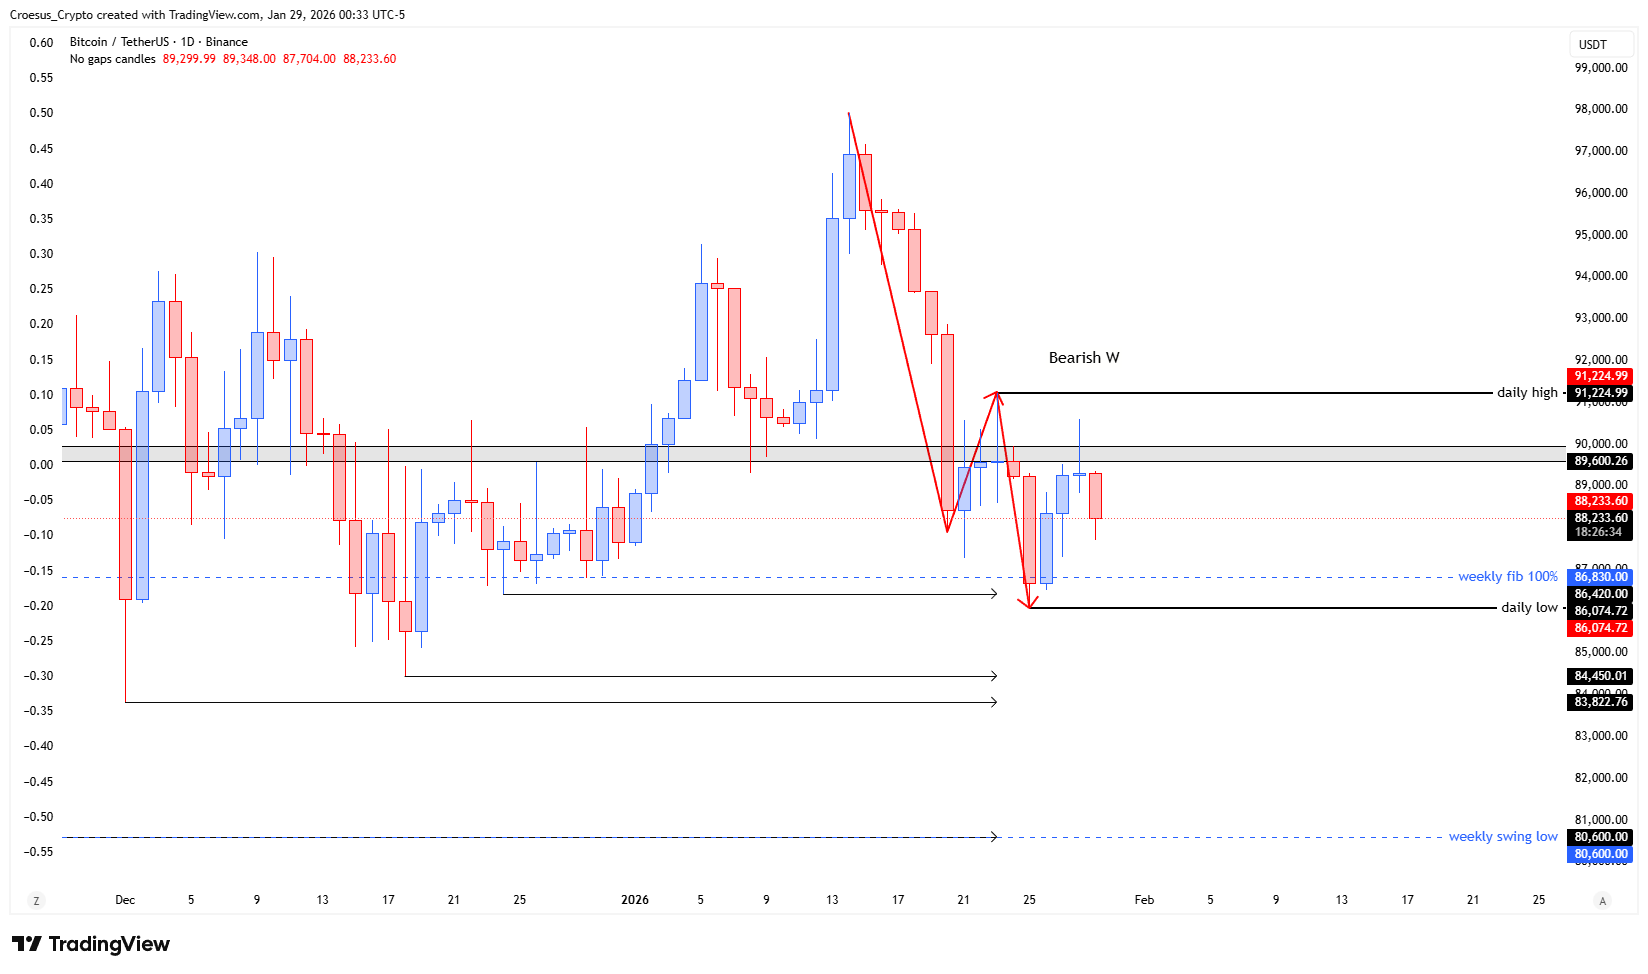
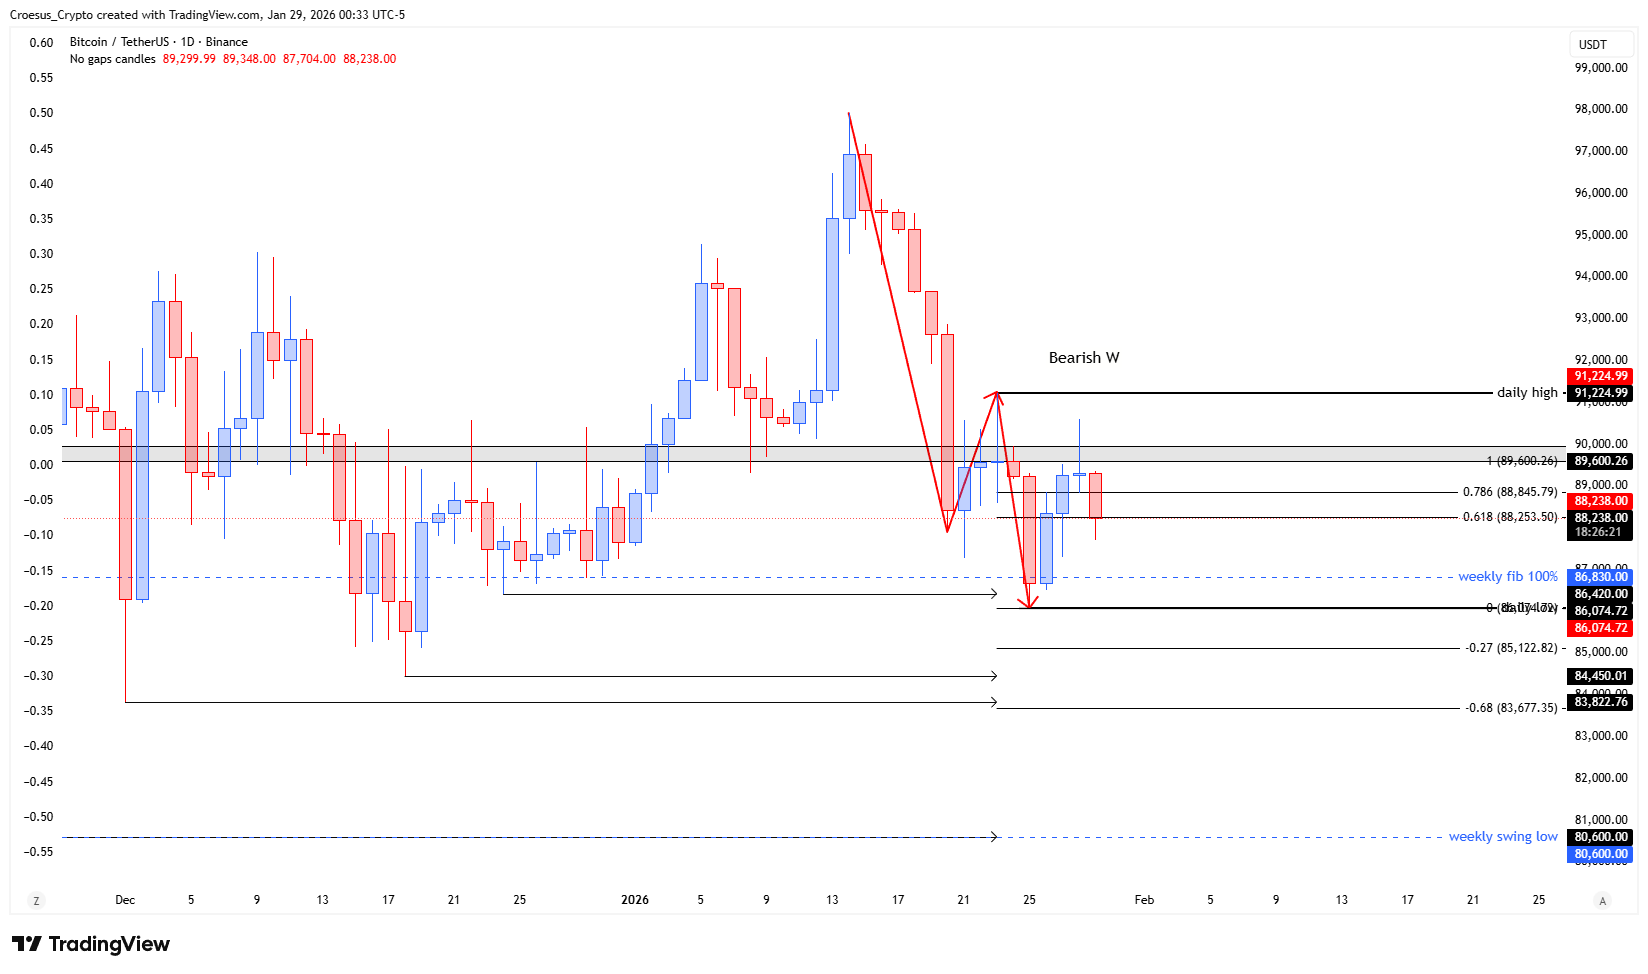
- The price shows us a clear rejection at the daily entry zone with a swing failure (long wick of rejection)
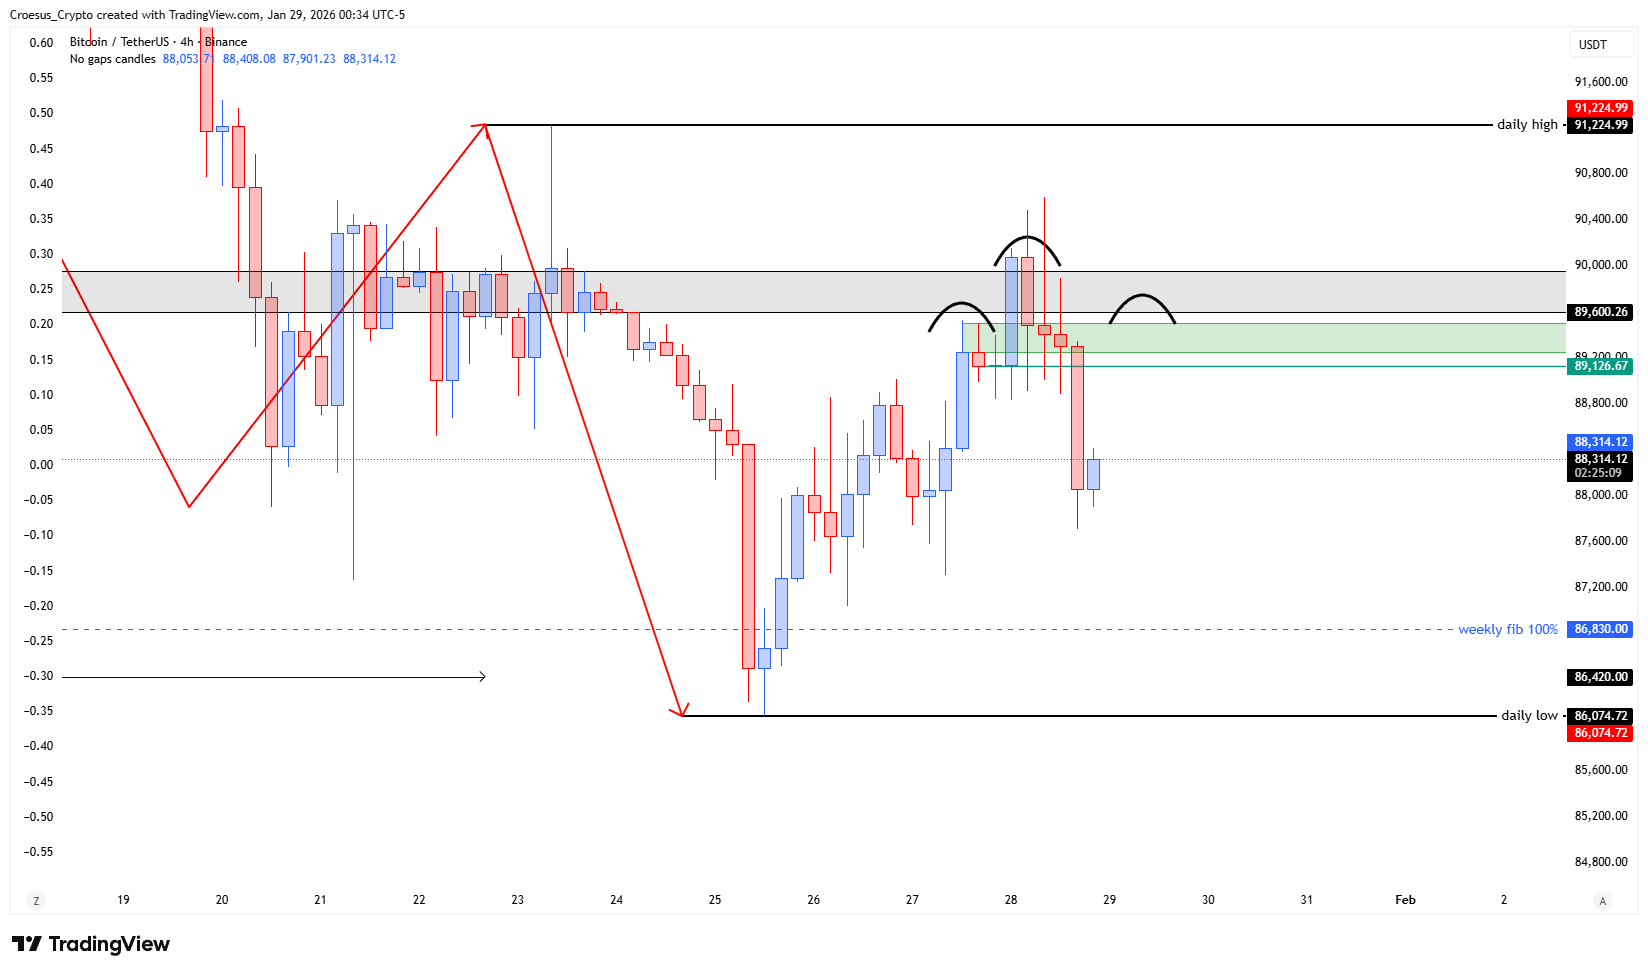
- If we zoom in on the 4H timeframe, we can see a head & shoulders pattern. Retest of the shoulders would be our best entrypoint.
Market Structure Analysis
From a market structure perspective, the long rejection wick at the daily entry zone reads as a swing failure: price briefly trades into a liquidity area, then snaps back, suggesting sellers defended that zone and trapped late buyers. This kind of response often shifts the short-term structure into a corrective posture, where price either consolidates below the rejection area or steps down toward the next support resistance band.
Zooming into the lower timeframe, the head & shoulders pattern reinforces the idea of distribution: the shoulders define a local supply zone and the “neckline” becomes the structural line that separates chop from downside continuation.
In our BTC daily analysis, the key is whether price can reclaim the rejected zone (bull trap risk fades) or whether it remains capped and continues to respect lower highs.
Key Levels and Scenarios
Bullish resolution requires acceptance back above the daily rejection area, turning it into support and invalidating the bearish shoulder supply. Bearish continuation stays favored if price remains below that entry zone and reacts bearishly on any retest of the shoulder region, keeping pressure toward the neckline and prior swing supports.
- Daily entry zone: prior decision point and the rejection/swing-failure area
- Shoulder retest zone (4H): key supply area where bearish reactions would confirm distribution
- Head & shoulders neckline: structural trigger area separating consolidation from continuation
Trading Implications
Given the rejection, aggressive participants typically look for confirmation on lower timeframes around the shoulder retest, while conservative participants often wait for clear structure (either a reclaim of the daily zone or a decisive break-and-hold below the neckline). Risk management matters most here because swing failures can lead to fast reversals in both directions.
This analysis is for informational purposes only and does not constitute financial advice.