


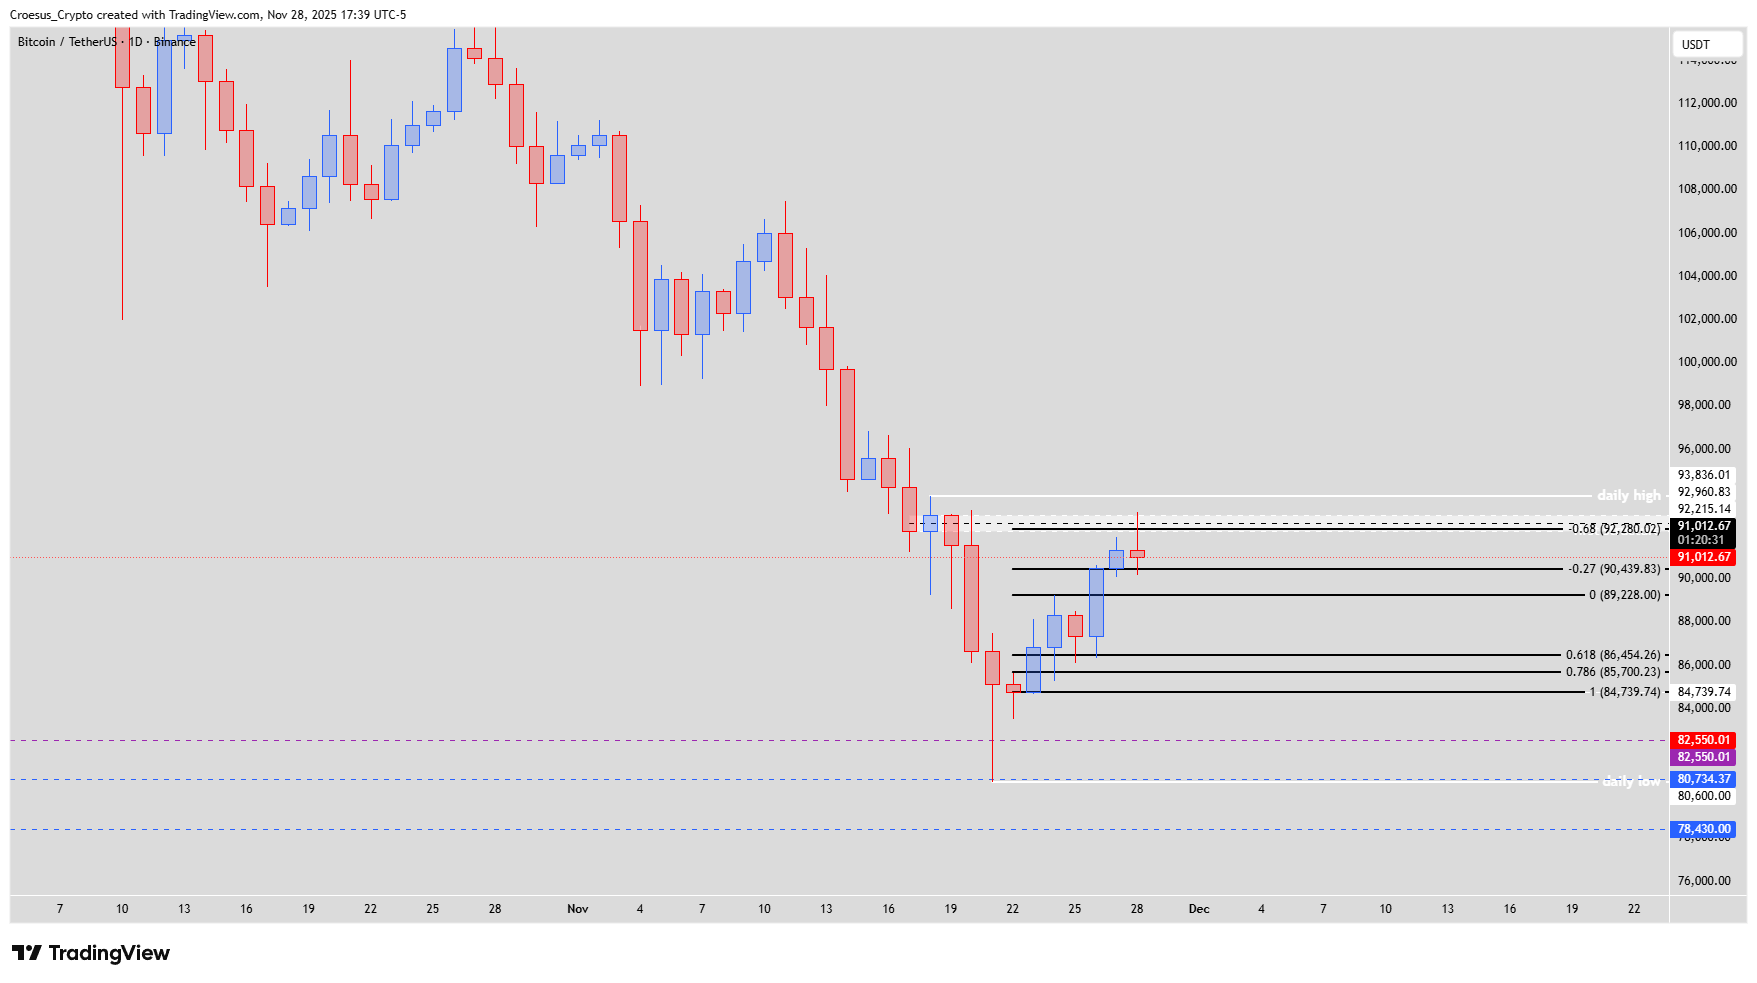
In this BTC daily analysis for 28 November 2025, we see price completing a cleaner tag of the Fibonacci -0.68 and the daily entry zone before posting a sharp rejection. Our technical analysis frames the current move as a bullish correction within a broader bearish trend.
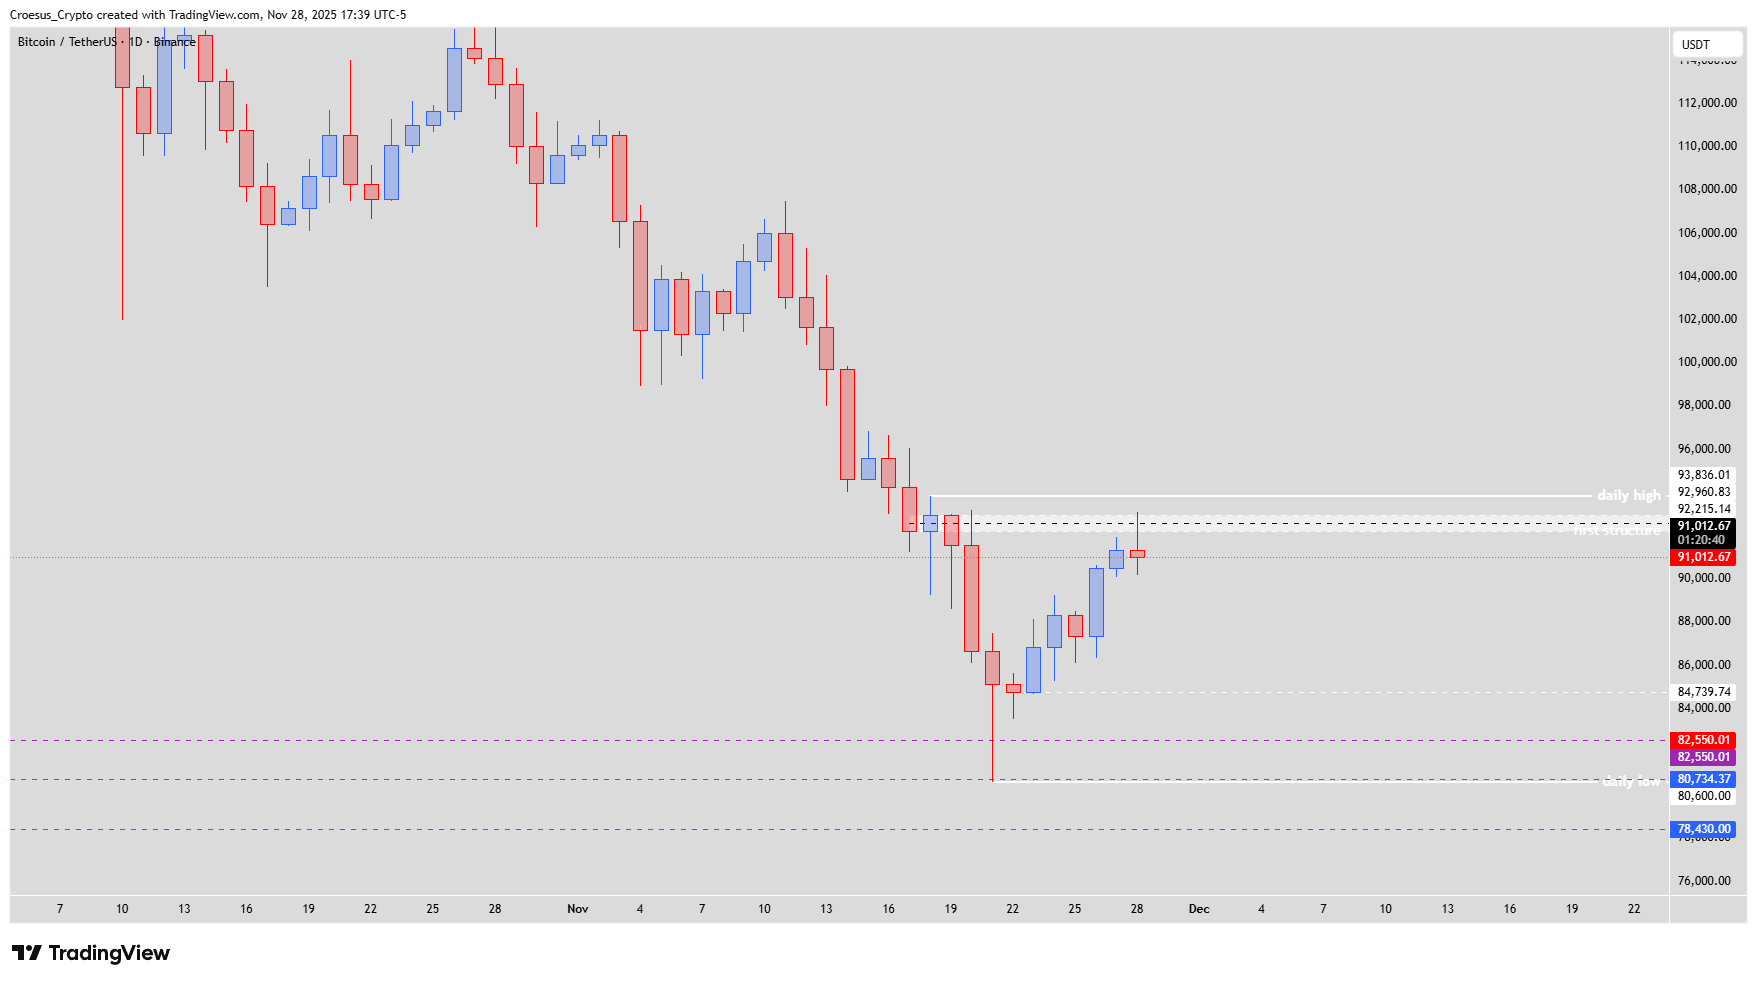
BTC daily chart November 28 2025 showing corrective bounce into first structure below daily high at 93,836.01 $.
Trend = bearish ↓
Technical Analysis Key Points
- Where yesterday kept going strong above the -0.27, but not touching the -0.68 and daily entry zone yet, today both those levels were hit.
- After hitting those levels in the NY morning session, price had a strong rejection in the NY afternoon session.
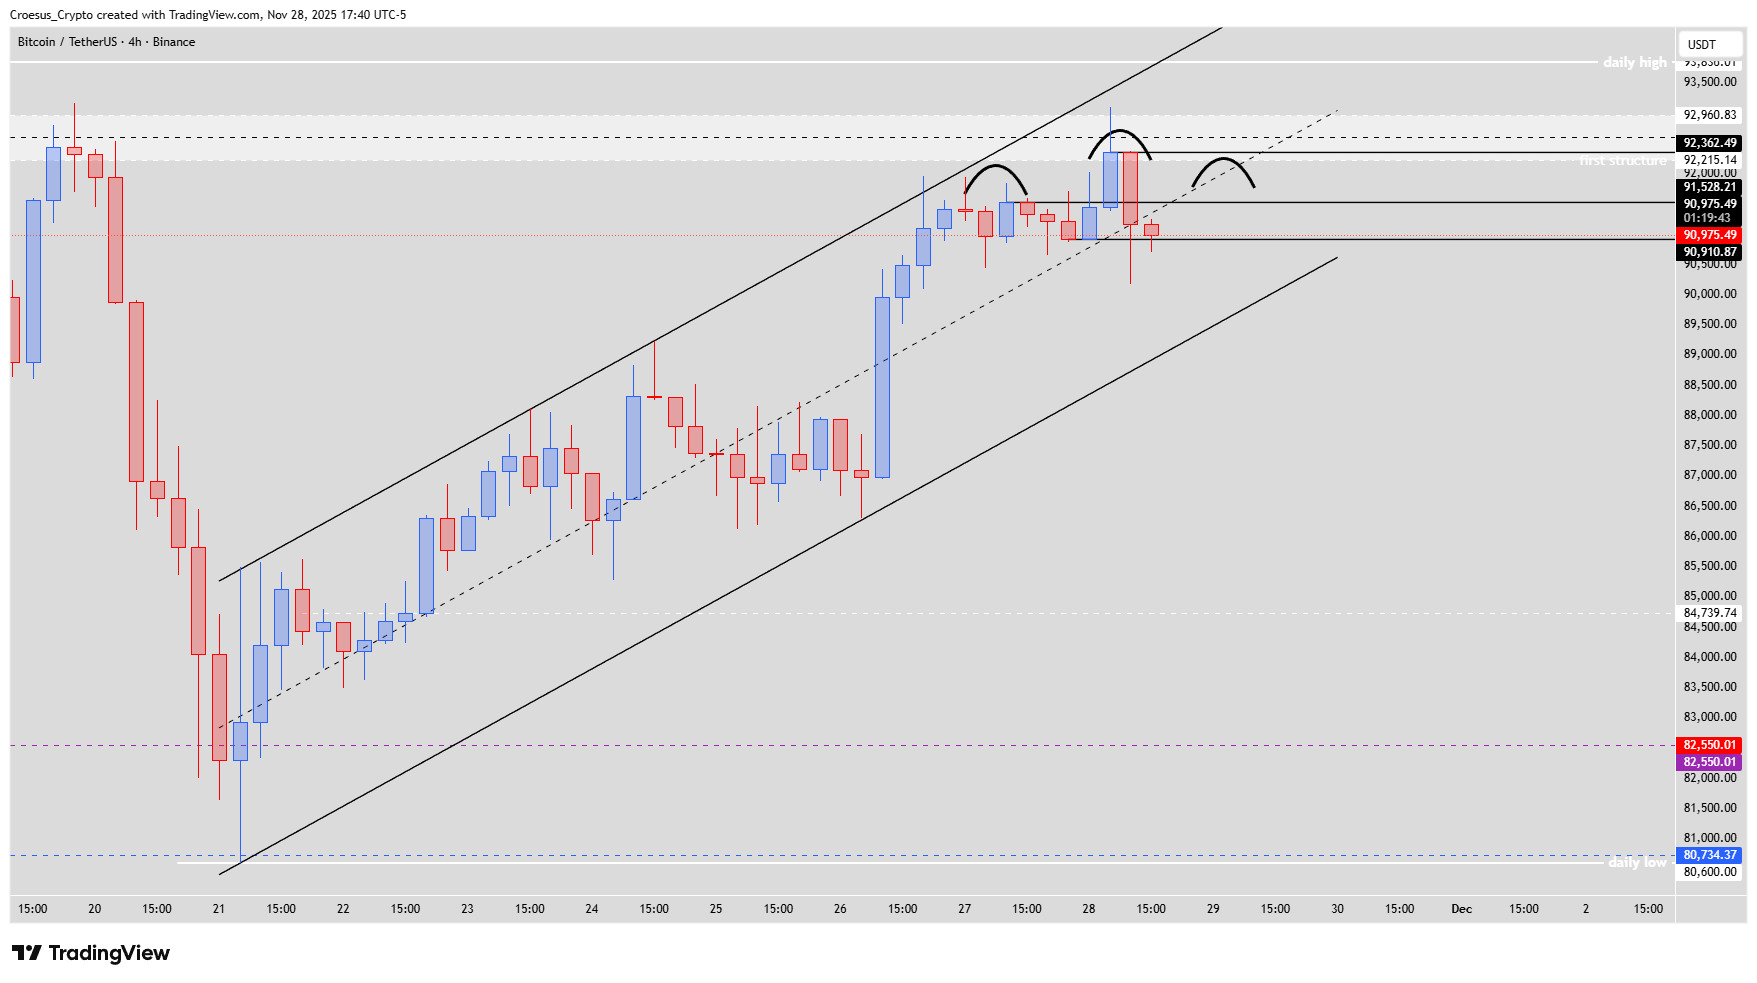
- If we look at the 4H timeframe, we can notice that price moved nicely in an rising channel and is potentially forming a head and shoulders pattern. Printing a double top also could be possible.
- To get a bullish bias price needs to break the daily high and defend this level @ 93,836.01 $
- As long as there is no bullish reversal, we need to treat this bullish move as a correction of the last bearish leg down. Price could react bearish when hitting the 92,215 $ level.
Market Structure Analysis
From a market structure perspective, BTC is still trading inside a corrective leg after a strong bearish impulse down. Price extended above the -0.27 Fibonacci level and finally tagged both the -0.68 extension and the daily entry zone, where supply clearly stepped in during the NY afternoon. On the 4H chart, the rising channel frames this bullish correction, while the potential head and shoulders or double top near the channel top highlights weakening momentum. Until there is a confirmed bullish break in structure, we treat this move as a retracement toward resistance rather than a trend reversal in support resistance terms.
Key Levels and Scenarios
Bullish scenario: buyers must break and hold above the daily high at 93,836.01 $ to flip bias and invalidate the current bearish correction narrative.
Key Levels
93,836.01 $ – Daily high; key level to reclaim and defend for a sustained bullish bias.
92,215 $ – Resistance area where price could react bearish inside the correction.
Daily entry zone / -0.68 – Confluent Fibonacci resistance that already triggered rejection.
-0.27 – First Fibonacci extension that previously held as intraday support.
Trading Implications
For active traders, our BTC daily analysis favors waiting for 4H confirmation of reversal patterns near 92,215–93,836 $, keeping risk tight above the daily high while targeting a rotation back down the channel if bearish follow-through appears, in line with prudent position sizing and stop-loss discipline.
This content is for educational purposes only and is not financial advice; always do your own research before making any investment or trading decisions.