BTC Marketcap / Bitcoin
BTC daily analysis 28/04/2026. Bitcoin is showing renewed selling pressure after a retest into the daily high failed, keeping the short-term structure tilted bearish while price remains vulnerable to a rollover back into the prior range.
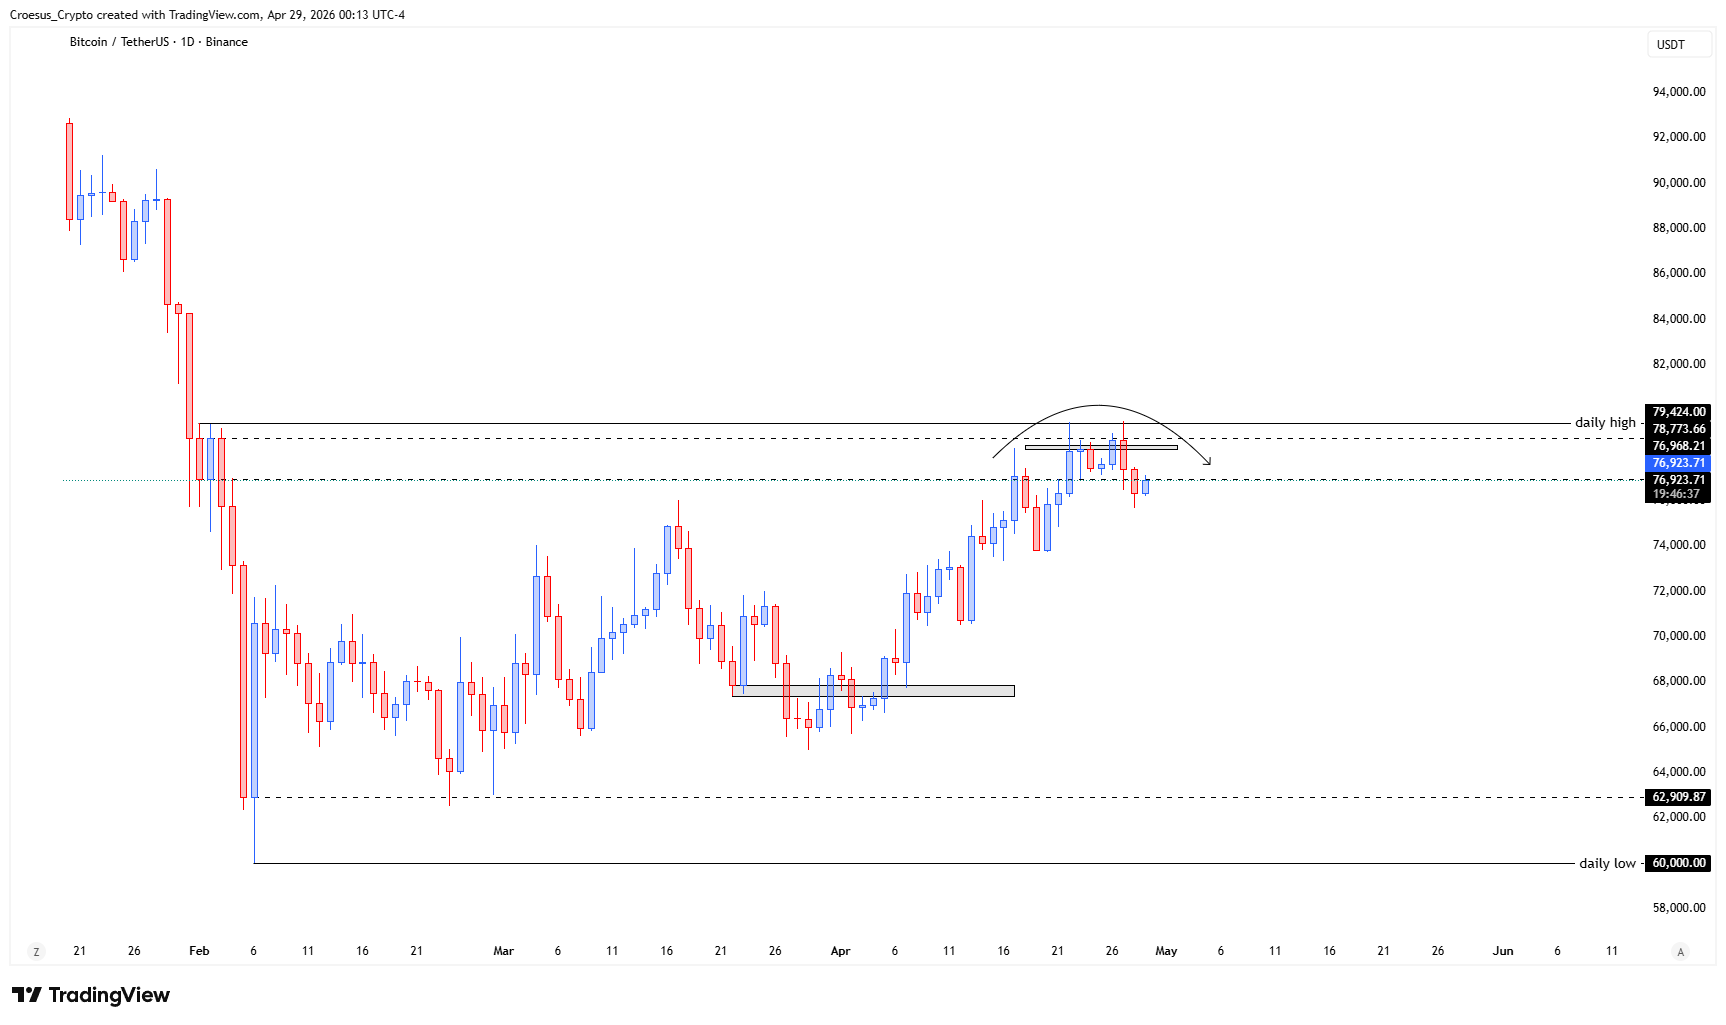
- BTC shows us a second bearish candle after retesting of and rejection at the daily high
- We can potentially see the formation of a head and shoulders pattern and price rolling over.
- Do we break above and hold the daily high ? Or do fall back into the range ?
- With equal highs at the daily high, there could be a lot of liquidity resting above that level. A sweep of liquidity above these highs before bearish continuation is probable.
Market Structure Analysis
From a naked trading perspective, our BTC daily analysis focuses on the rejection at the daily high and what it implies for market structure. The second bearish candle after a retest signals that supply is defending that horizontal resistance and that the latest push up is being absorbed rather than expanding into a clean impulsive breakout. The mention of a potential head and shoulders aligns with this idea: price is potentially transitioning from a corrective push into the range high into a reversal sequence where buyers fail to sustain higher prices. The equal highs at the daily high are structurally important because they often act as a liquidity pool; if price remains capped, the market can either roll over directly into the range or first run stops above the equal highs (liquidity sweep) before continuation lower. Until we see acceptance above the daily high, the current structure reads as bearish pressure building at resistance rather than bullish continuation.
Key Levels and Scenarios
In this BTC daily analysis, the main decision point is whether price can break above and hold the daily high. A clean break and acceptance would weaken the bearish rollover thesis. Failure to reclaim that level keeps the range re-entry and bearish continuation scenario in play, with the added risk of a stop-run above the equal highs before the move develops.
- Daily high: key horizontal resistance that must be reclaimed and held to shift structure
- Equal highs at the daily high: liquidity zone where a sweep can occur before continuation
- Range boundary: the area price may fall back into if the rejection holds
- Rejection zone at the daily high: invalidation/confirmation area for the rollover attempt
This analysis is for informational purposes only and does not constitute financial advice.