


BTC Marketcap / Bitcoin
BTC daily analysis 28/05/2026. Bitcoin is trading in a bearish context after falling back into a prior weekly key level, putting the focus on whether this zone holds as support or breaks for continuation lower.
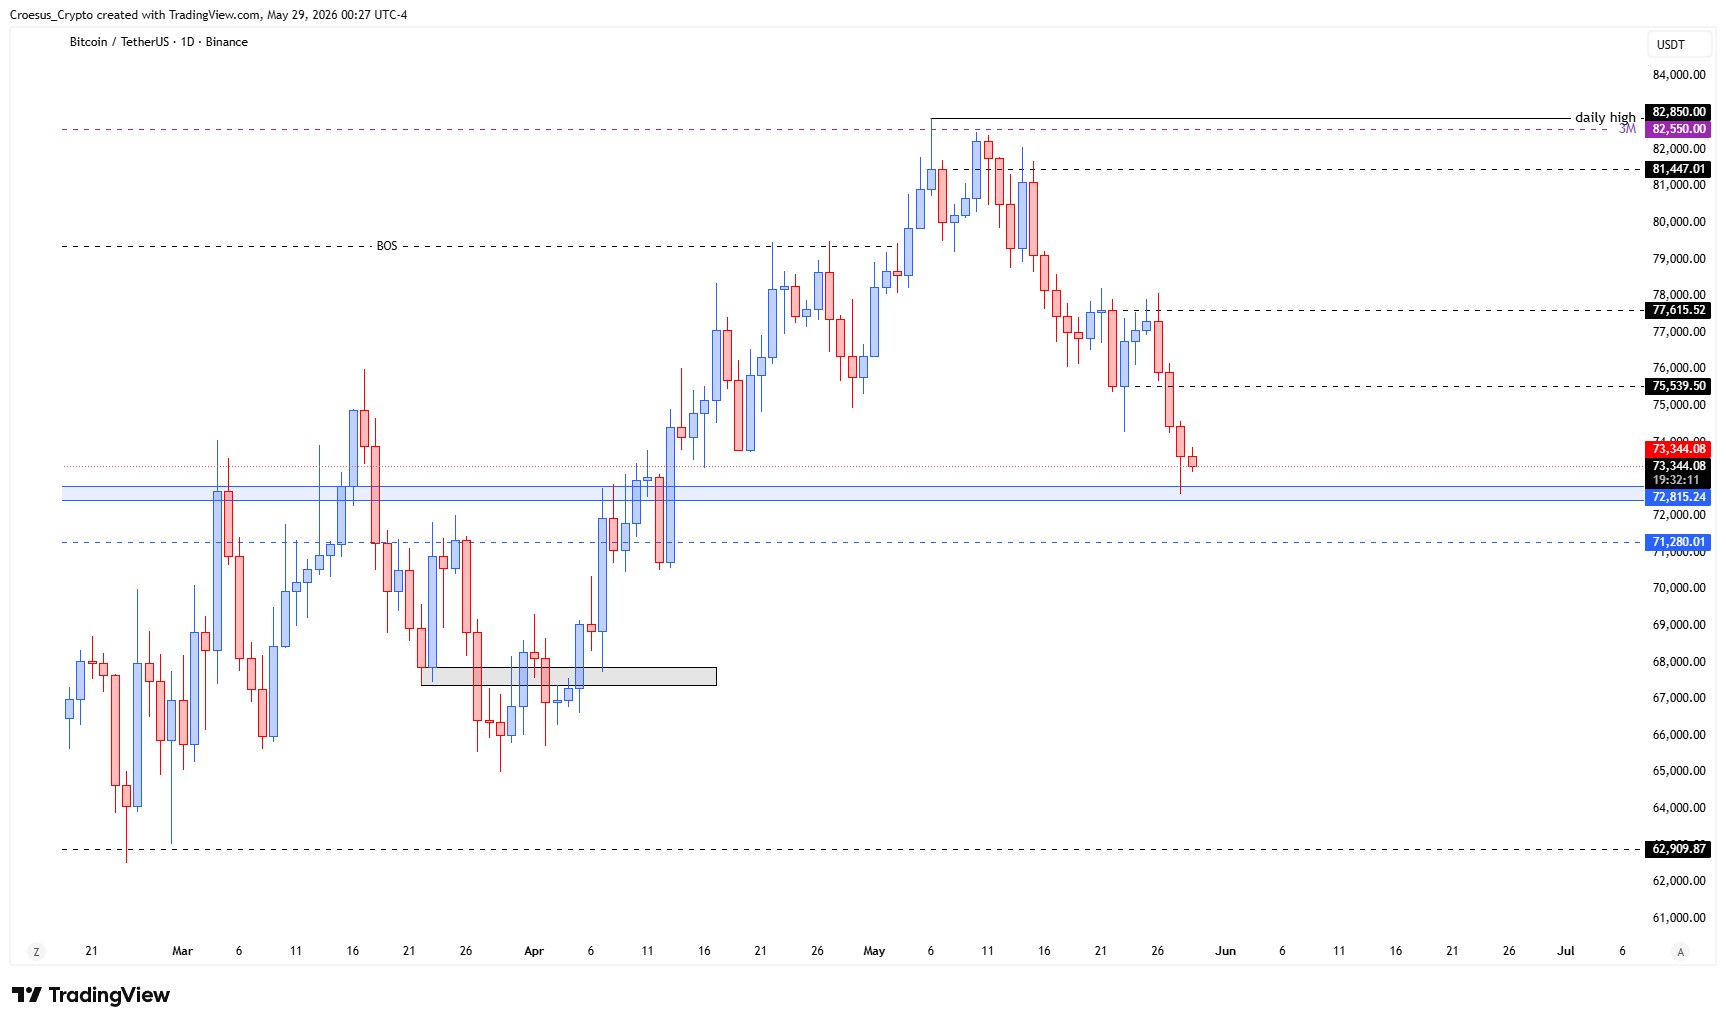
- BTC shows us that price fell back towards the weekly key level, the first structure.
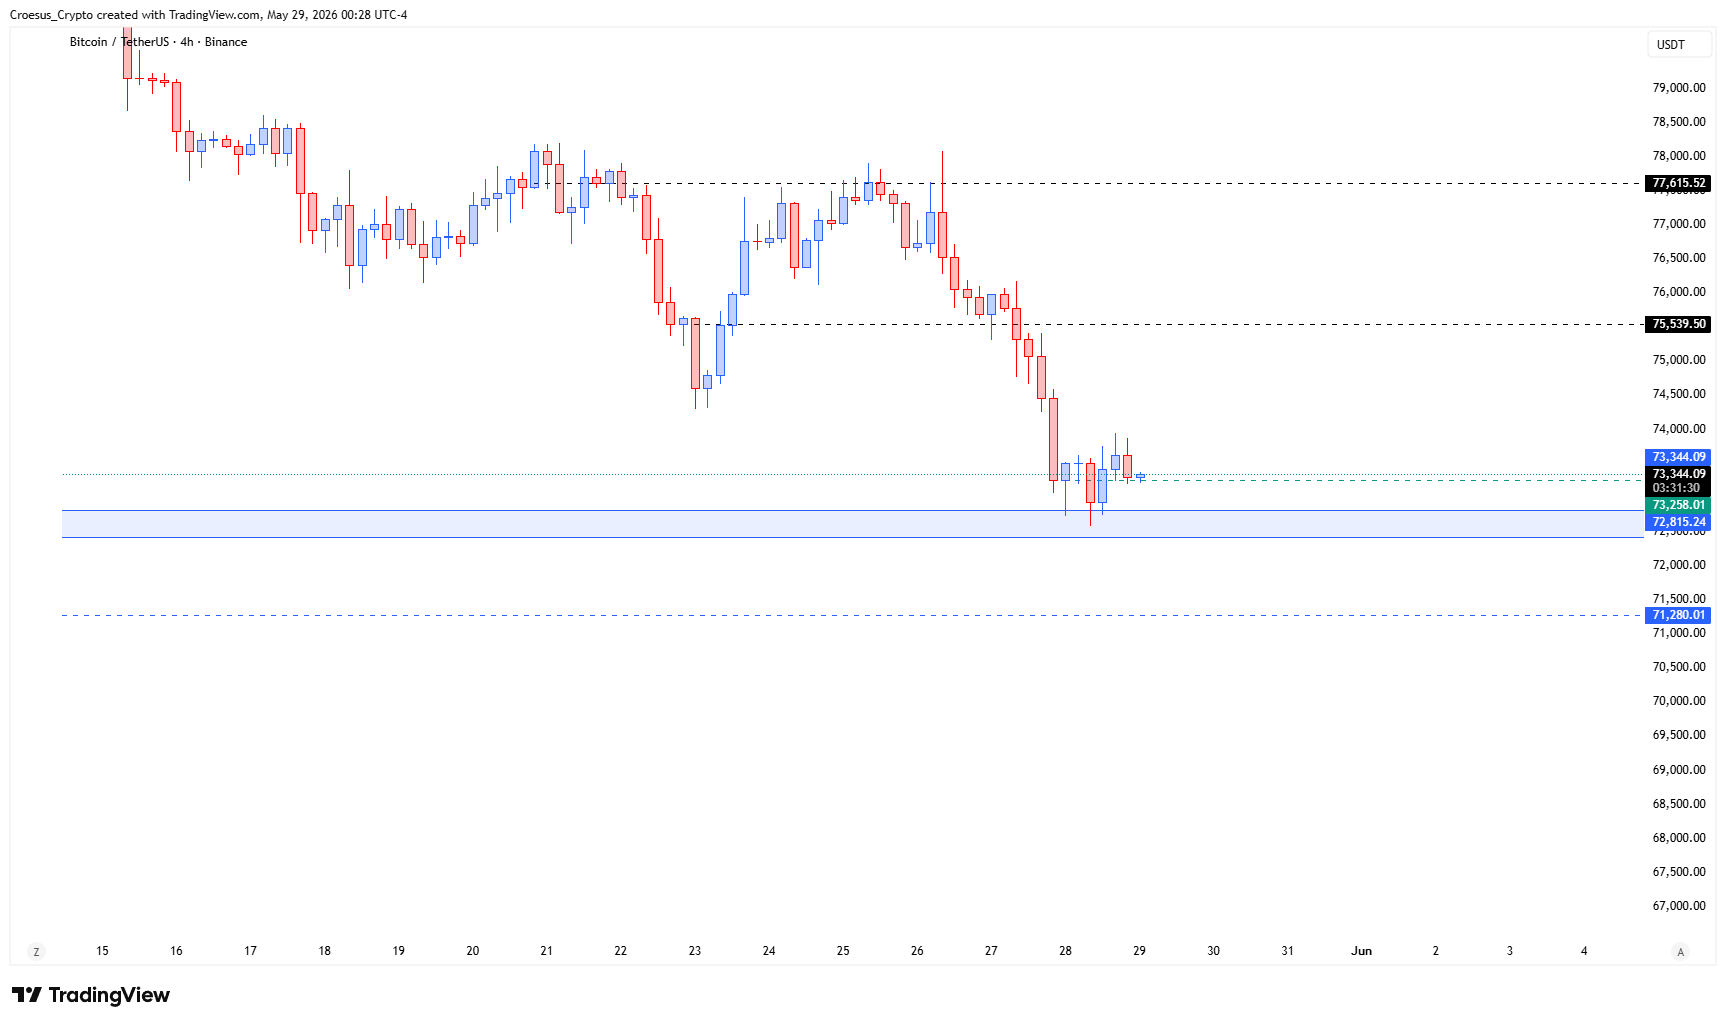
- Now we need to zoom in and look for an eventual confirmation of reversal on the 4H timeframe. There we can see a potential inverse H&S.
Market Structure Analysis
Our BTC weekly analysis highlights a classic “back to structure” move: price previously traded away from a key weekly level and has now retraced into that area, meaning this is the first major decision point for market structure. In a bearish trend, the clean read is that this retest can act as a resistance-to-support test that fails, or as a base for a corrective rebound that later challenges overhead supply. The draft notes a potential inverse head and shoulders on the 4H timeframe, which typically signals short-term accumulation and an attempt to reverse locally after a selloff. Structurally, that would suggest sellers are losing momentum into the weekly level and buyers are starting to defend the range low. Confirmation matters here: until the 4H structure breaks upward and holds, the weekly pullback can still resolve as continuation to the downside.
Key Levels and Scenarios
For this BTC weekly analysis, the bearish scenario remains active if price loses the weekly key level and accepts below the first structure, signalling a breakdown. A bullish corrective scenario requires the 4H inverse H&S to confirm with a break and hold above its neckline, turning short-term structure into support resistance that can carry price away from the weekly base.
- Weekly key level (“first structure”) as the primary decision zone
- Acceptance below the weekly structure as bearish continuation confirmation
- 4H inverse H&S neckline as the trigger level for short-term reversal confirmation
- Reclaiming and holding above the neckline as the key support flip for a corrective bounce
Trading Implications
Aggressive traders typically focus on lower timeframe confirmation at the weekly level, while conservative traders usually wait for a clear break of structure and a retest to reduce false-signal risk. In a bearish trend, failed reclaim attempts at resistance remain a key invalidation concept for any long thesis.
This analysis is for informational purposes only and does not constitute financial advice.