


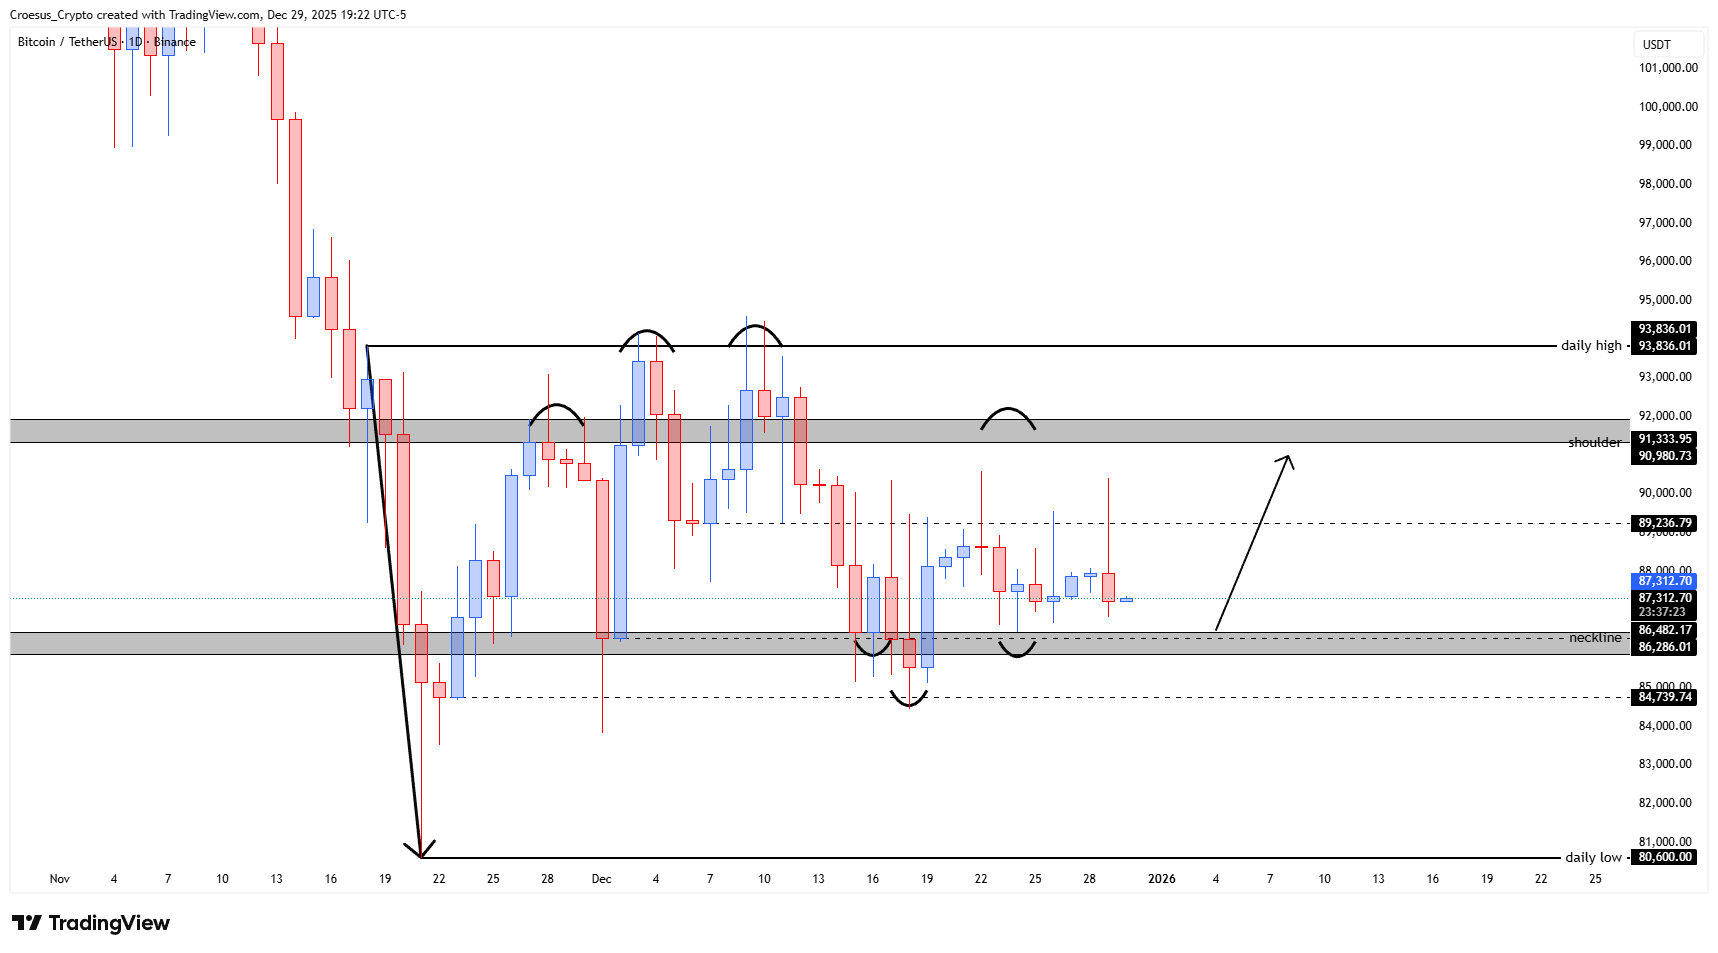
Our BTC daily analysis for late December 2025 looks at a potential reversal setup after a strong vertical selloff into the 80,600 USDT daily low. Price has since been consolidating in a tight range just above the neckline area, hinting at a possible shift from aggressive selling to accumulation.
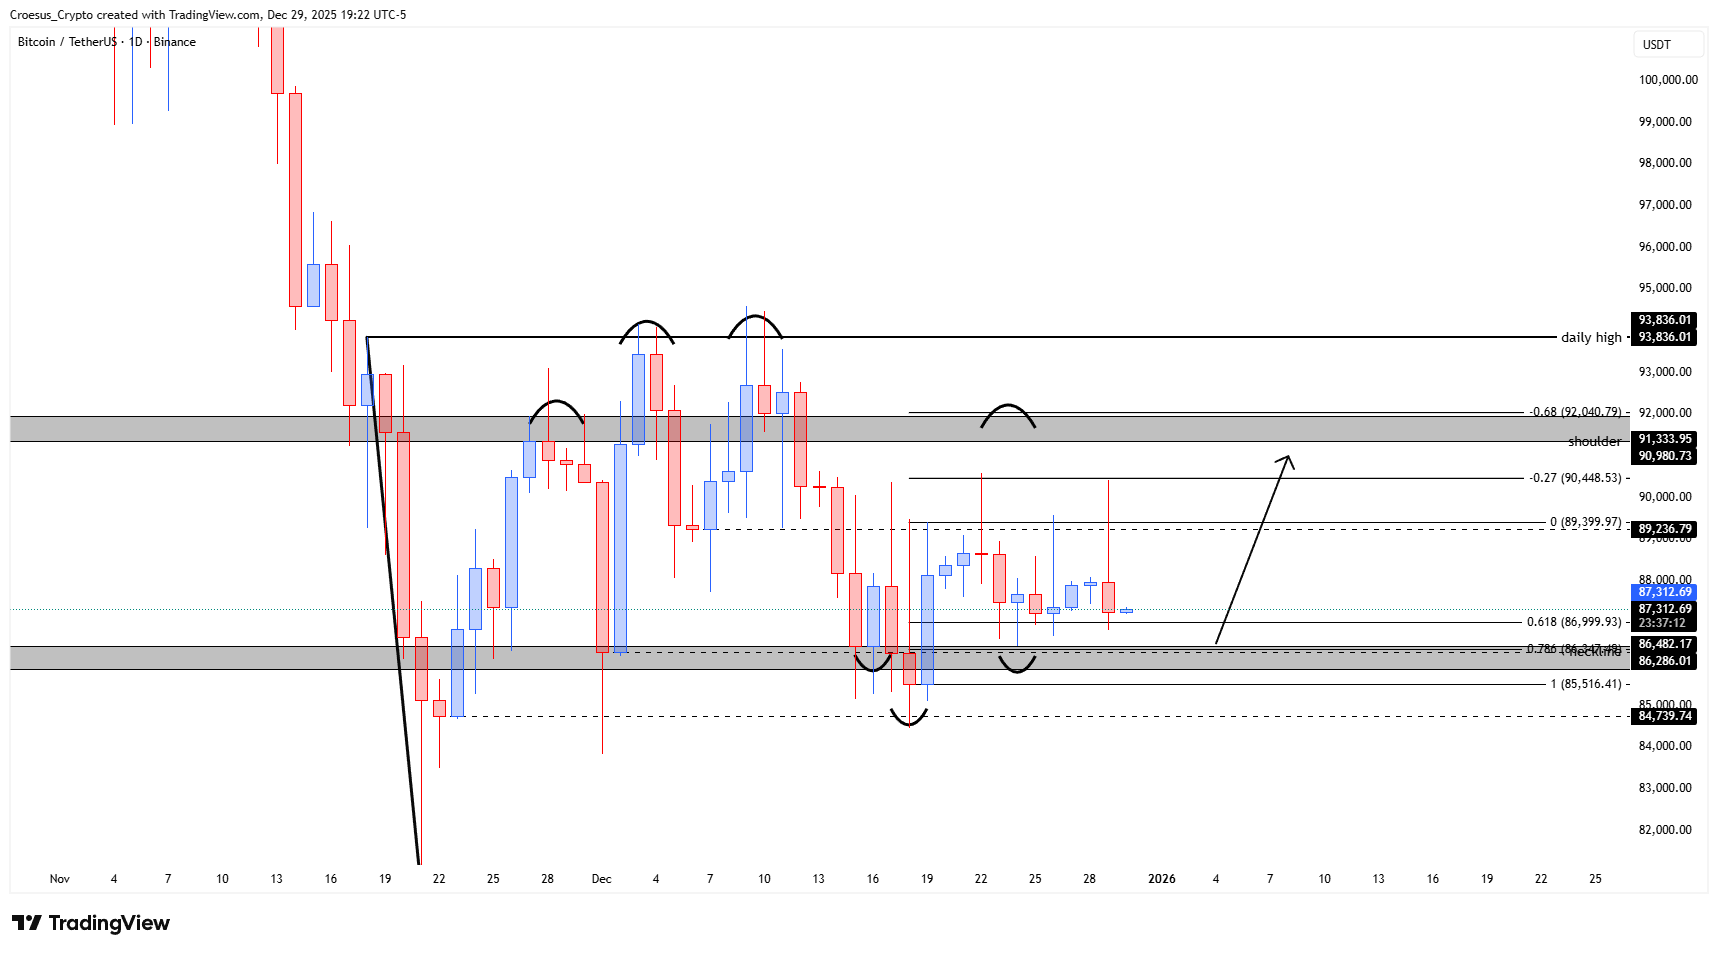
BTC daily analysis zoom on consolidation above 86K neckline with 0.618 Fibonacci at ~87K and upside arrow toward 89K–91K resistance.
Technical Analysis Key Points
- Strong vertical selloff into the 80,600 USDT daily low followed by sideways consolidation
- Clear inverse head and shoulders structure with neckline around 86,300 USDT
- Current price trades near 87,300 USDT between neckline support and the 0% Fibonacci area around 89,400 USDT
- Major resistance cluster at 90,900–91,300 USDT “shoulder” zone, with a higher daily high at 93,836 USDT
Market Structure Analysis
From a technical analysis perspective, BTC has transitioned from a steep downtrend into a range bounded by roughly 80,600 and 93,800 USDT. The inverse head and shoulders pattern suggests selling pressure is fading, provided the neckline around 86,300 USDT continues to hold as support.
Below price, we see layered demand from the 1.0 Fibonacci extension near 85,500 down to 84,700 and finally the 80,600 daily low. Above, the first meaningful support resistance flip is the 89,200–89,400 USDT band (0 Fibonacci), then the shoulder zone at 90,900–91,300 USDT, and finally the 93,836 USDT daily high.
Key Levels and Scenarios
Bullish scenario:
If BTC keeps closing above the neckline (≈86,300 USDT) and reclaims the 0.618 Fibonacci (~87,000 USDT) with conviction, our BTC daily analysis favors continuation toward 89,200–89,400 USDT, then the 90,900–91,300 USDT shoulder zone. A breakout there would open a path toward retesting the 93,836 USDT daily high.
Levels to watch
80,600 USDT – Major daily low and full invalidation of the reversal idea
84,700–85,500 USDT – Deeper demand zone and last defense before lows
86,300 USDT – Neckline support; key pivot for the inverse H&S
89,200–89,400 USDT – Mid-range resistance and 0 Fibonacci reference
90,900–91,300 USDT – Shoulder resistance; breakout trigger toward 93,836 USDT
Trading Implications
As long as BTC holds above the 86,300 USDT neckline, dips into 86K–87K can be viewed as potential long opportunities with targets at 89K–91K, while invalidation sits below 85.5K or, more conservatively, below 80.6K, making careful position sizing and tight risk management essential.
This is not financial advice; always do your own research and manage your risk appropriately.