


BTC Marketcap / Bitcoin
BTC daily analysis 29 January 2026. Bitcoin is trading in a bearish environment, with price reacting directly from a predefined entry zone and now pressing into a higher-timeframe invalidation area that can decide whether the current corrective structure survives or breaks down.
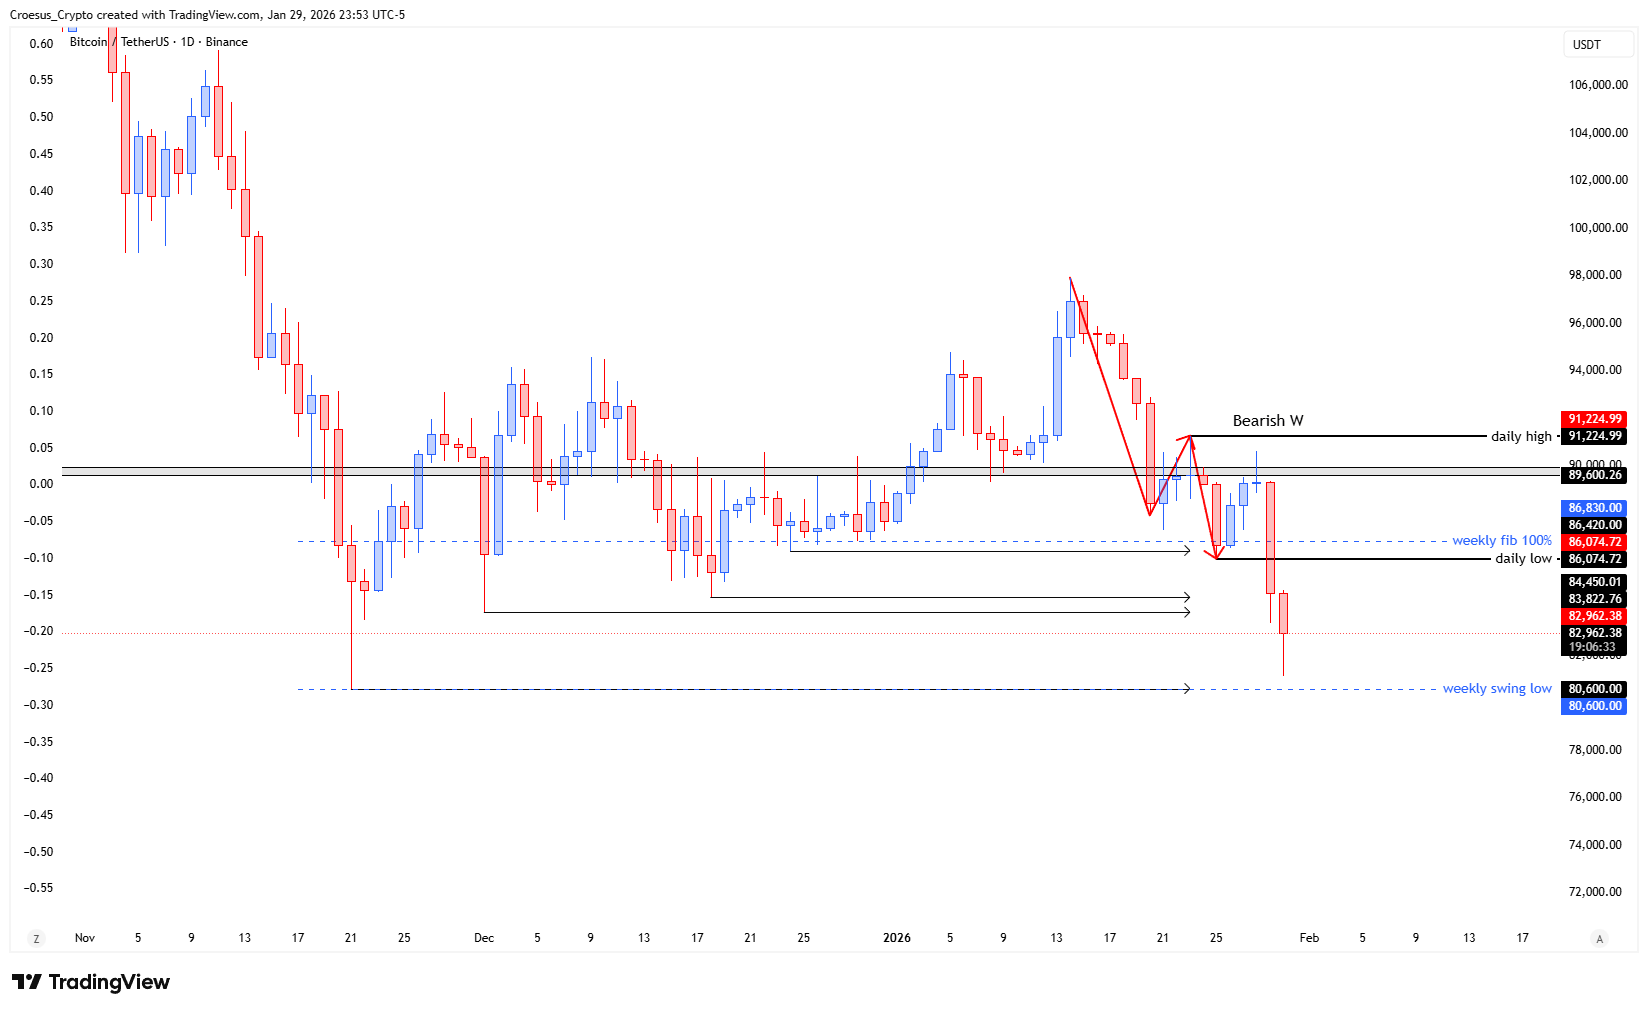
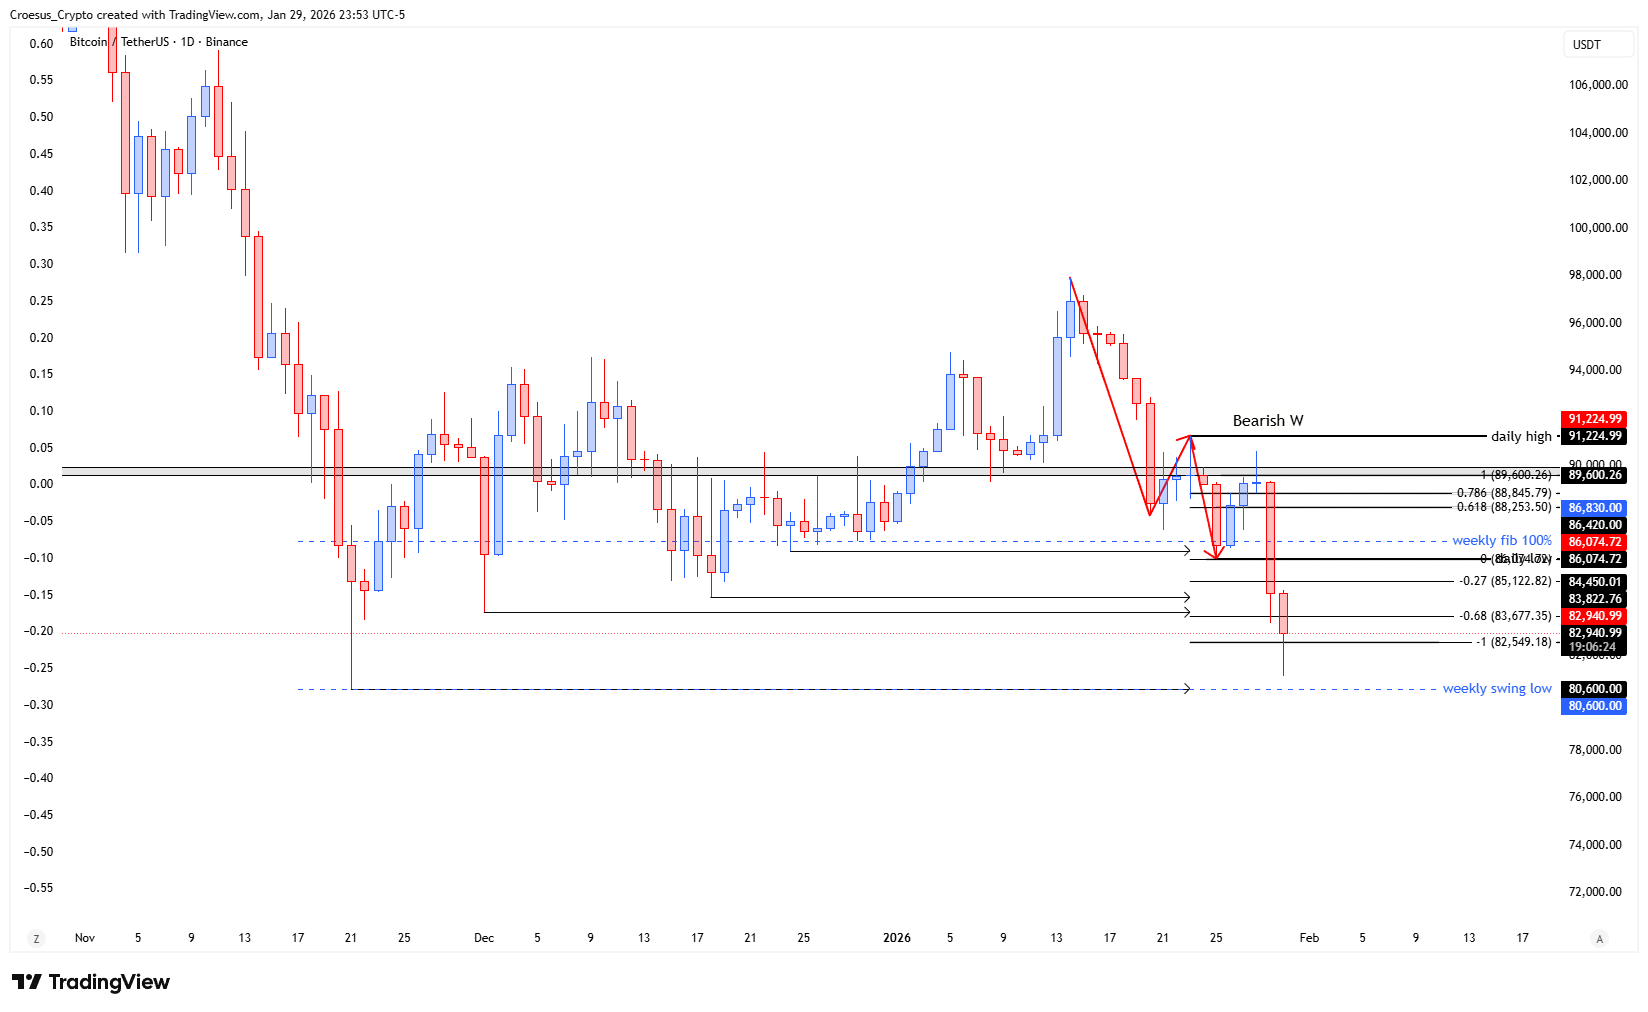
- The price hit the daily entry zone and completed the bearish W until the fib -1
- At this moment the price is moving inside the weekly fake out zone, near to the weekly swing low. This is the invalidation point. A close below this level means that a larger correction of the weekly bearish impulse is no longer in play or at least is under stress.
Market Structure Analysis
Our BTC daily analysis shows price already delivered an impulsive downside leg that “completed the bearish W until the fib -1,” which frames the recent move as a structured continuation rather than a random sell-off.
Structurally, this matters because once a measured move completes, the market often shifts into either a corrective retracement or a continuation grind, and both outcomes tend to respect clear horizontal support resistance zones.
The key context is the weekly layer: price is currently sitting inside a “weekly fake out zone” and hovering near the weekly swing low. That weekly swing low acts as the line in the sand for the broader bearish impulse—holding it keeps the possibility of a larger weekly correction alive, while losing it signals the bearish impulse is reasserting control and any corrective structure is failing. Fibonacci is present here as confirmation only (the fib -1 completion), while structure and closes around the weekly level remain the primary decision tool.
Key Levels and Scenarios
In this bearish technical analysis, the market is defined by whether BTC defends the weekly swing low while stabilizing after the completed move into Fibonacci extension. A daily reclaim and acceptance back above the weekly fake out zone supports a corrective bounce; a clean close below the weekly swing low increases downside continuation risk and puts the “larger correction of the weekly bearish impulse” under clear stress.
- Daily entry zone: the origin of the latest sell continuation and near-term reference for resistance on any bounce
- Fibonacci -1 completion area: signals the measured bearish leg has reached its extension objective
- Weekly fake out zone: current decision area where acceptance/rejection can set the next swing
- Weekly swing low (invalidation point): a close below shifts structure toward continued bearish continuation
Trading Implications
Aggressive participants typically focus on the close and acceptance around the weekly swing low, while conservative traders often wait for a clear reclaim of broken structure or a confirmed breakdown close before committing. With BTC daily analysis centered on an invalidation level, risk is defined by structure rather than prediction: the closer price trades to that weekly swing low, the more binary the outcome becomes.
This analysis is for informational purposes only and does not constitute financial advice.