BTC Marketcap / Bitcoin
BTC daily analysis 29/04/2026. Bitcoin prints a volatile session as traders position into the FOMC event risk, and our BTC daily analysis still reflects bearish continuation despite the intraday swings.
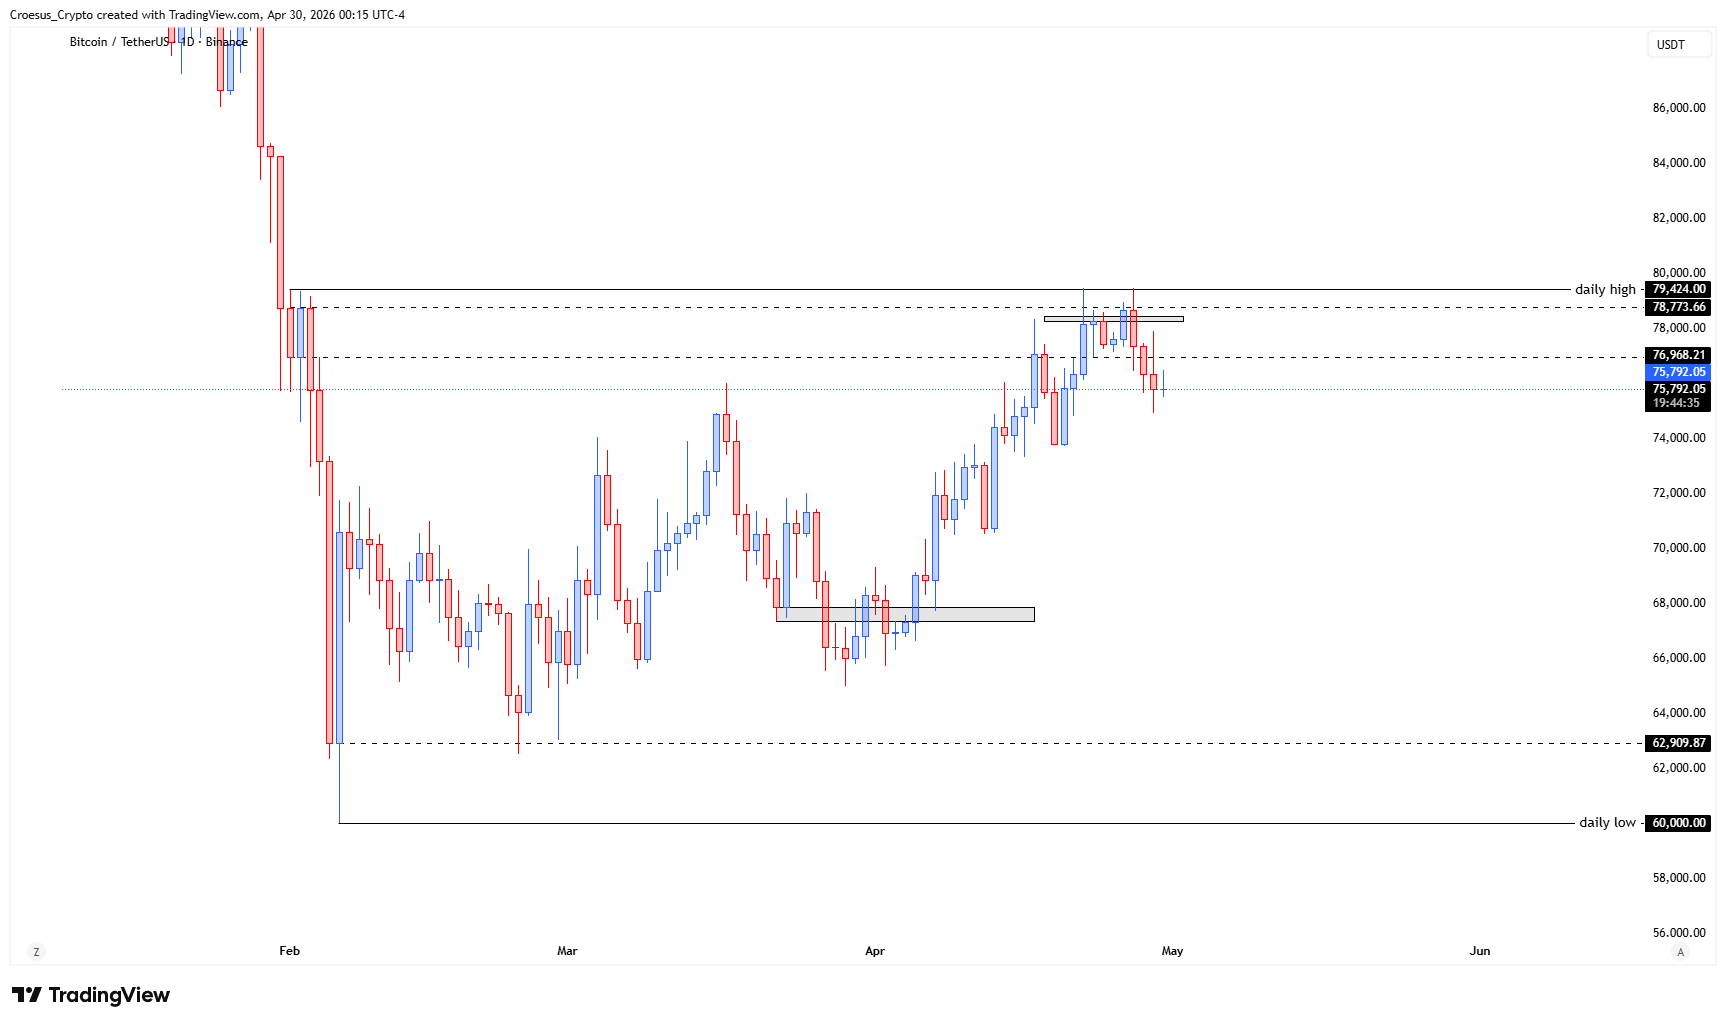
- BTC daily analysis shows us the price experiencing a volatile day caused by the anticipation of the FOMC meeting resulting in bearish continuation
- But with two relative equal highs resting at the daily high, we could suppose that there is a lot of liquidity resting above those highs. We could expect a sweep of that liquidity yet to come.
Market Structure Analysis
From a naked trading perspective, the key takeaway in this BTC daily analysis is the interaction between short-term bearish continuation and overhead liquidity. Volatility around major events often expands the range and forces price into nearby pools of stops, which is why the “two relative equal highs” matter structurally: equal highs commonly represent a clean liquidity target above resistance. If price is still trending down, a sweep of those highs can function as a liquidity grab before continuation, rather than an immediate reversal signal. In practical market structure terms, we want to see whether any push above the equal highs is accepted (holding above that prior daily high) or rejected (wicks and displacement back below), as that acceptance/rejection defines the next impulse vs corrective leg.
Key Levels and Scenarios
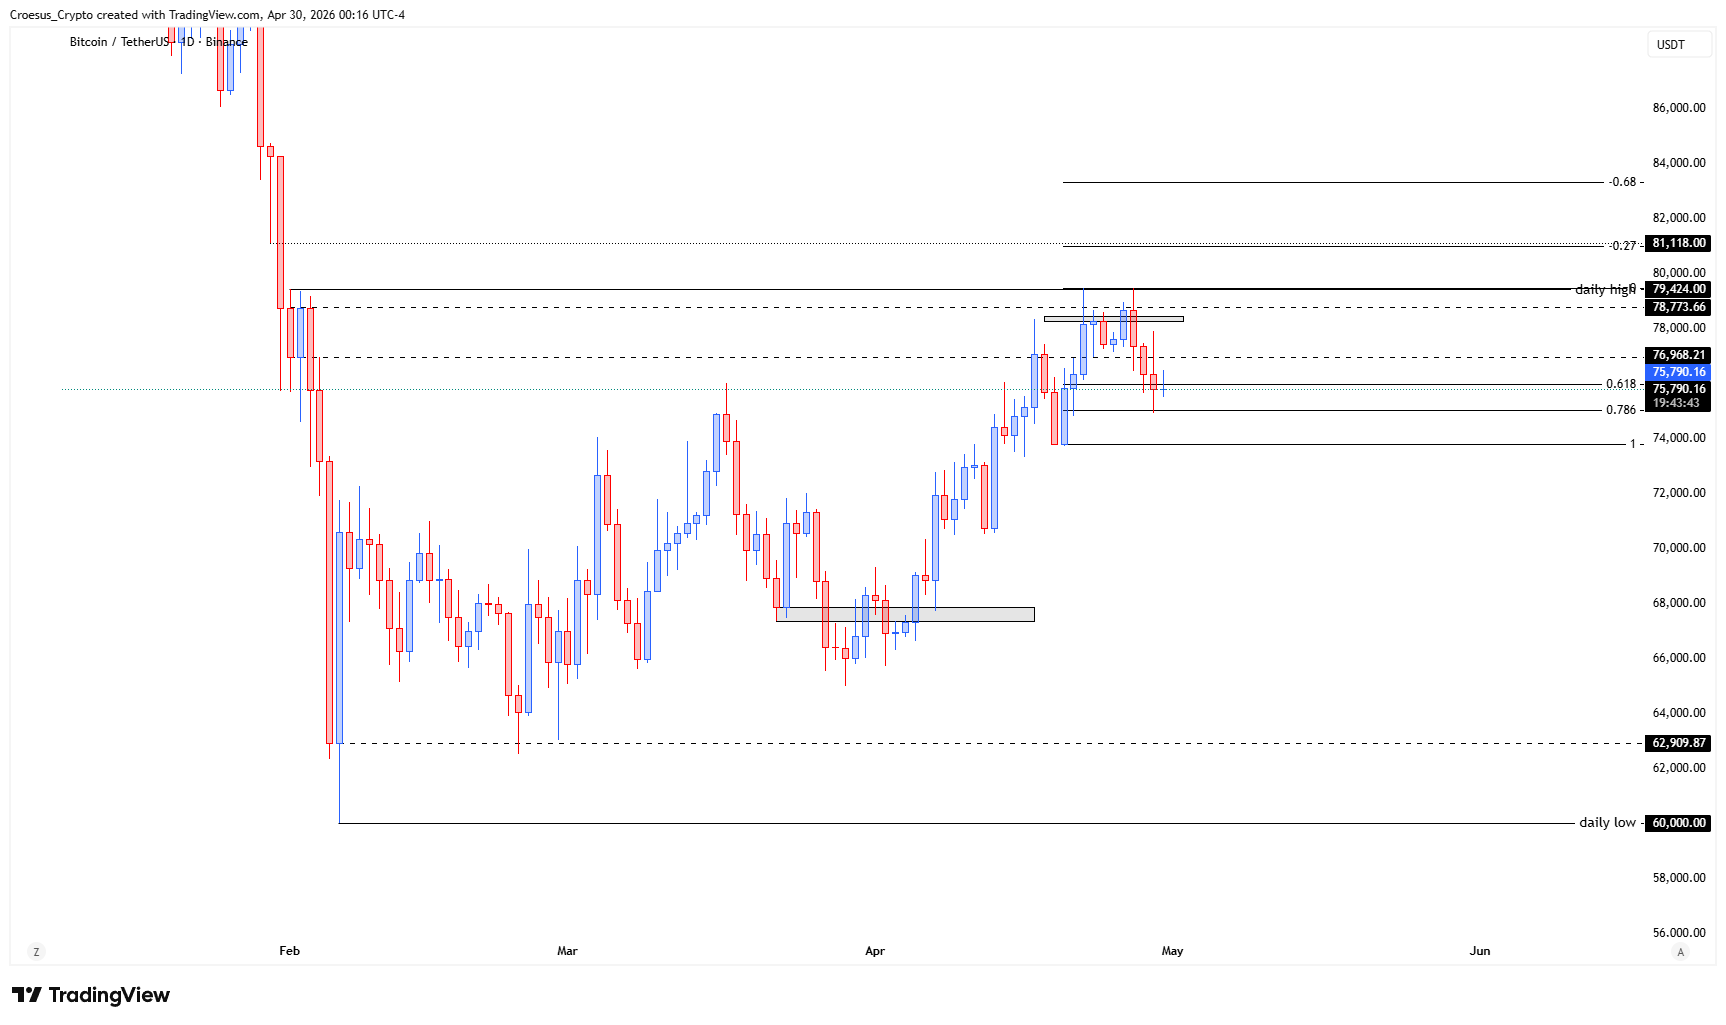
Bearish continuation remains favored while price fails to hold above the area of the two equal highs at the daily high. A bullish alternative requires a clear break and acceptance above that level, turning prior resistance into support resistance for a potential short-term reversal. Until then, the most actionable reference is the liquidity zone above the equal highs and how price reacts after any sweep.
Trading Implications
This is a headline-driven environment where spreads and wicks can distort entries, so execution quality depends on waiting for structure confirmation (sweep and rejection vs acceptance). Conservative participants typically let the post-event candle close define direction, while aggressive traders focus on the liquidity grab behavior around the equal highs within this BTC daily analysis.
This analysis is for informational purposes only and does not constitute financial advice.