


Our Bitcoin daily analysis for late November 2025 focuses on how price reacts around the daily entry zone after a sharp bearish leg down. Short-term structure remains corrective within a broader downtrend, and current technical analysis highlights a developing 4H head and shoulders pattern pressing against resistance and a rising channel support line. Until we see a decisive bullish reversal, we treat this move as a counter-trend rally into supply rather than a new impulse.
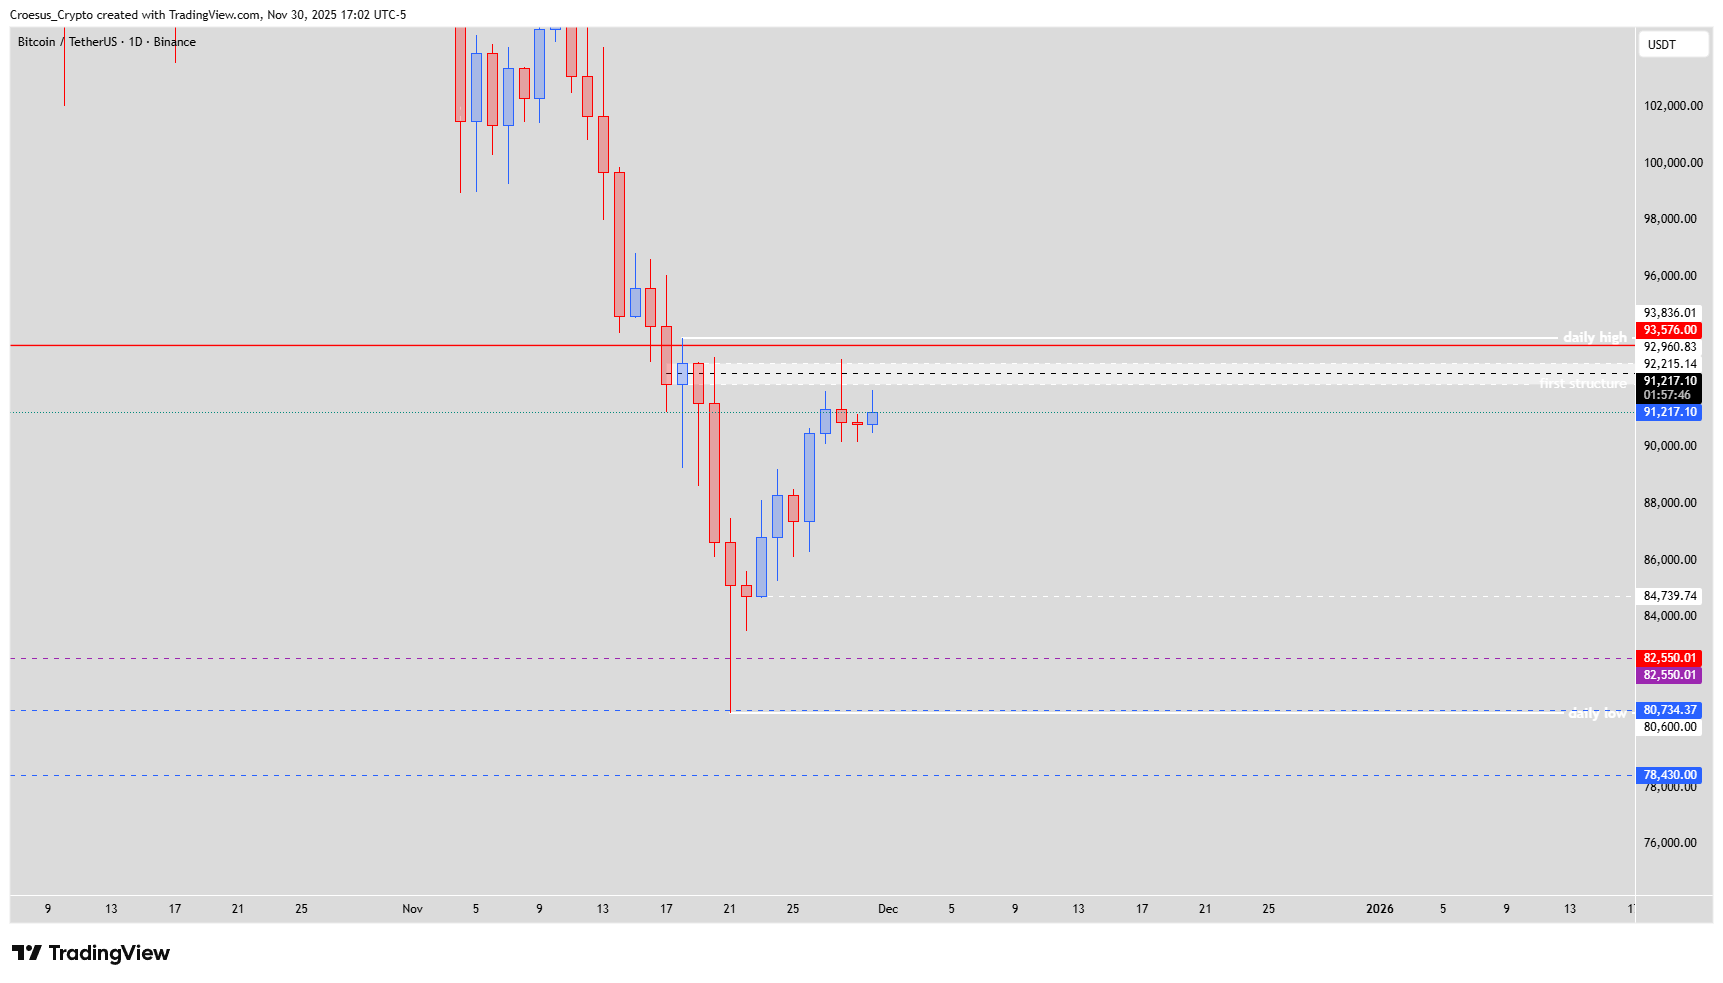
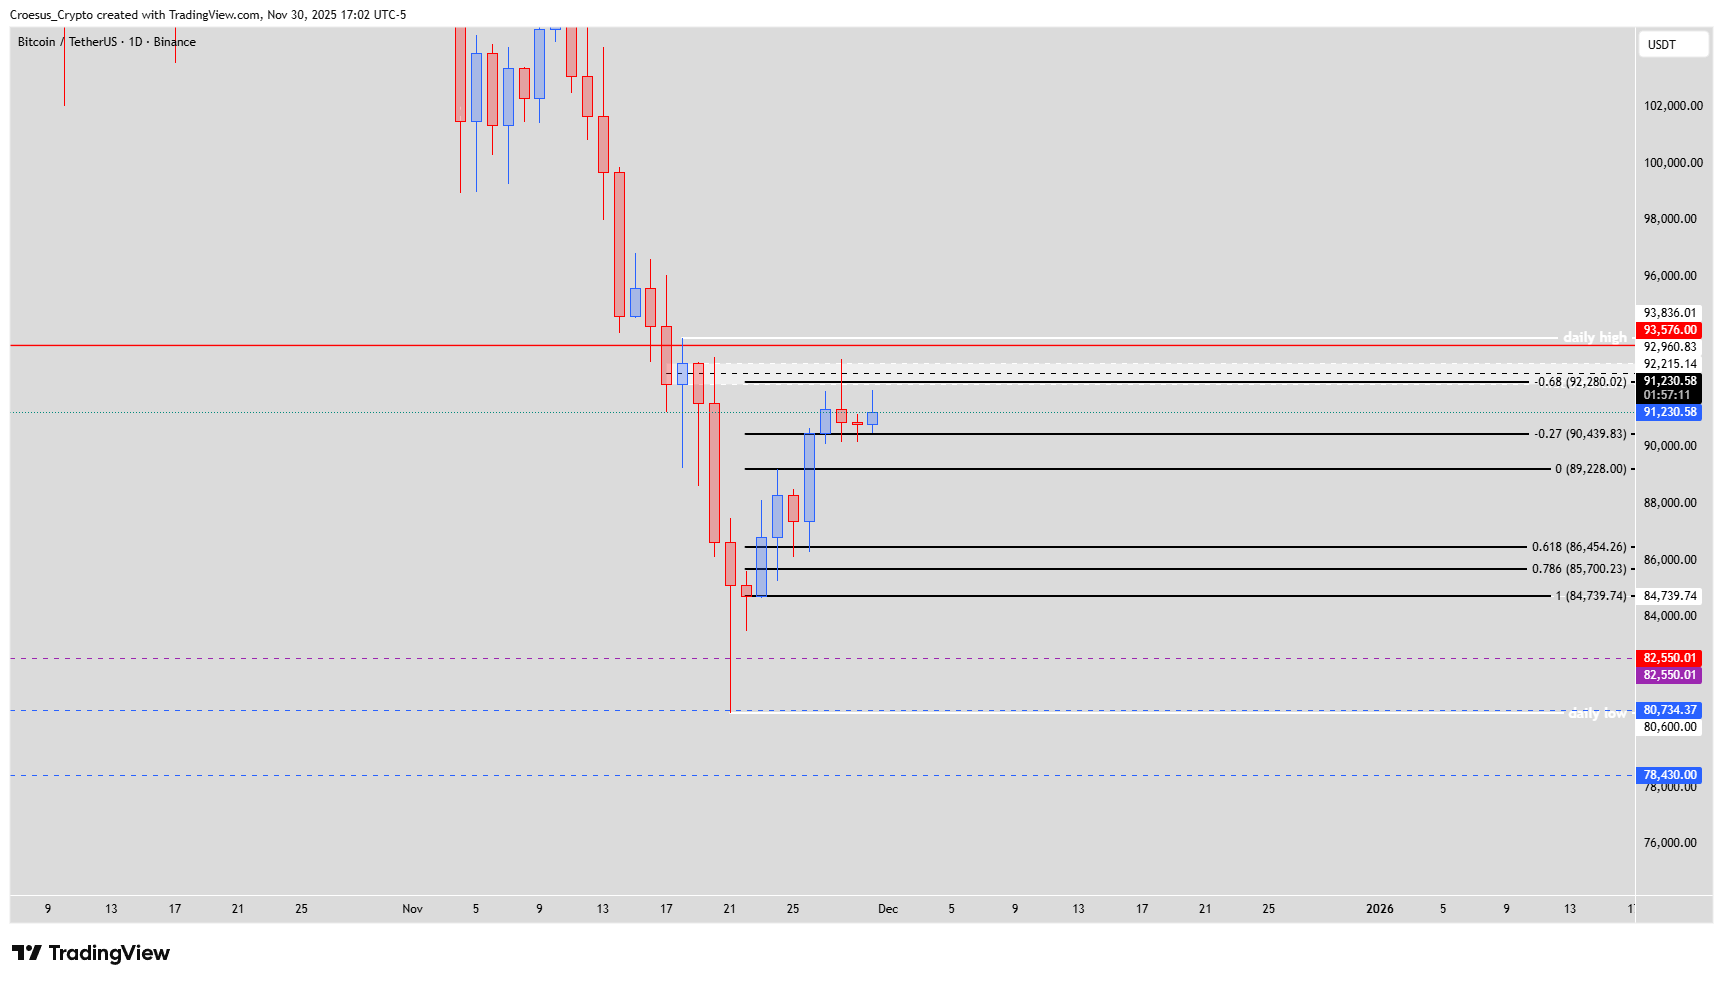
Bitcoin daily chart Nov 30 2025 highlighting daily entry zone, first structure resistance and daily high at 93,836.01
Trend = bearish ↓
Technical Analysis Key Points
- On Friday price clearly hit the daily entry zone.
- During the weekend there was not a lot of action on the price chart. If there was some action noticeable it was on the 4H timeframe.
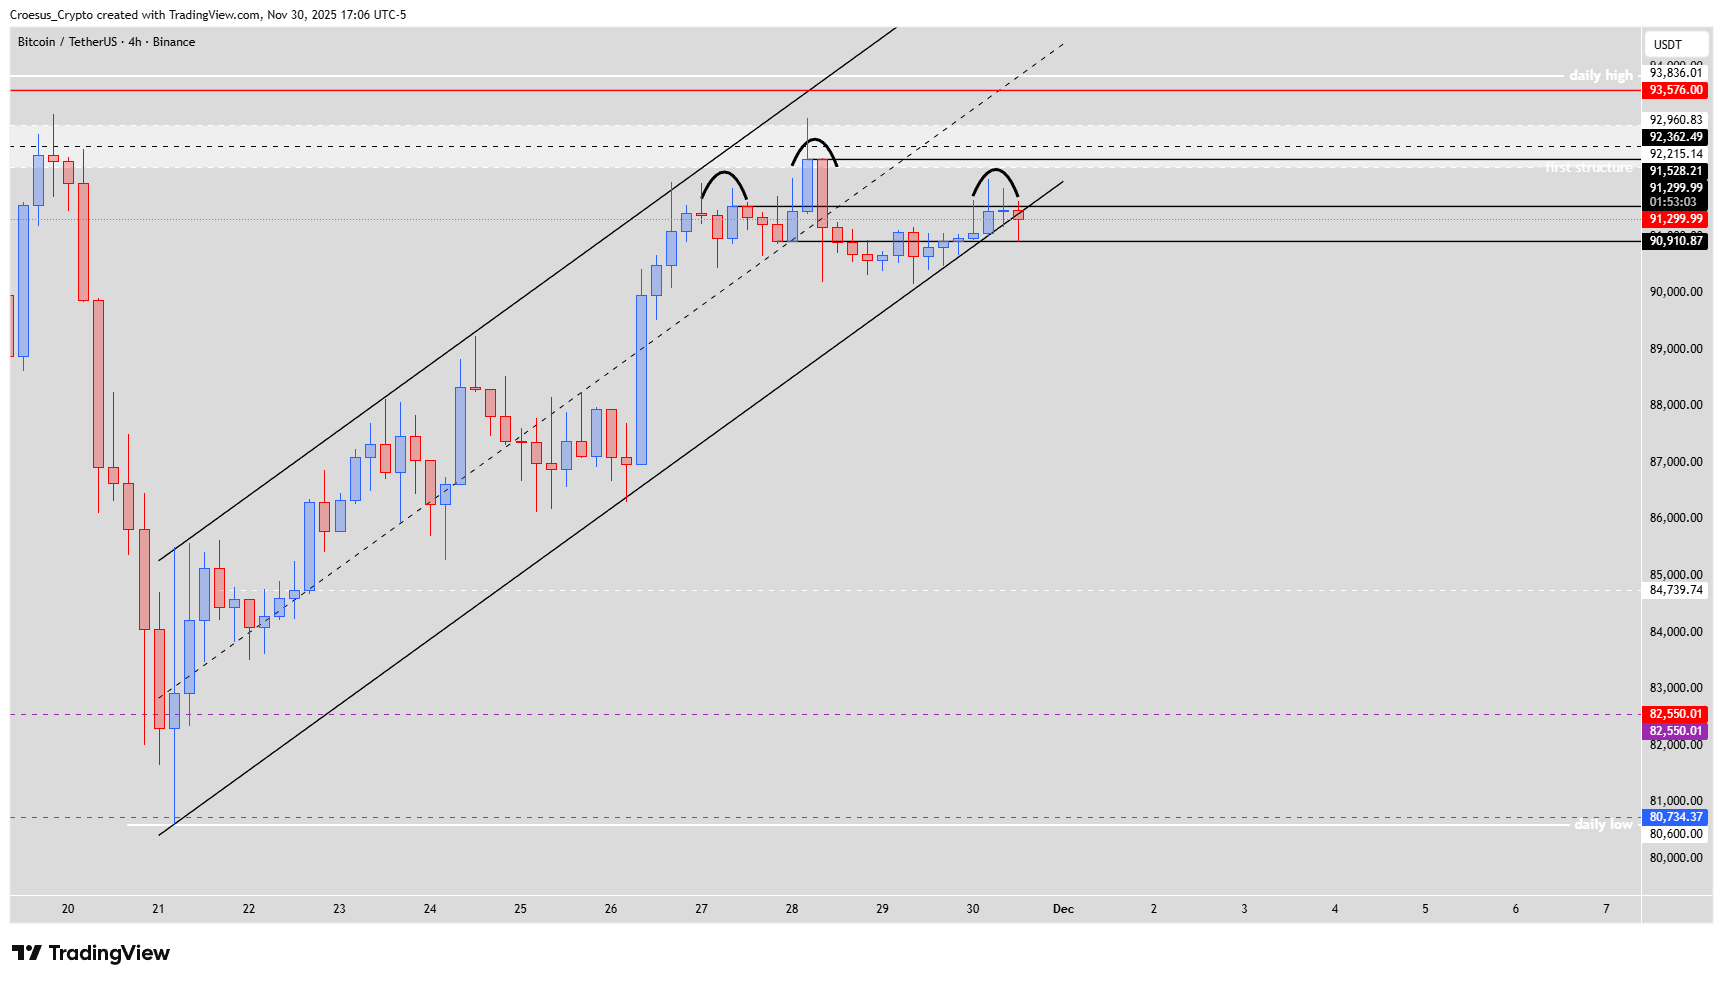
- On the 4H timeframe we can clearly see price making a head and shoulders pattern. The shoulder has been touched and respected.
- It seems that price on the 4H timeframe kept grinding up against the lower trendline, but now seems to braking that trendline.
- There is still no clear switch of momentum. Eventhough the bears pushed down the price on Friday, during the weekend the momentum seemed to be fading away.
- To get a bullish bias price needs to break the daily high and defend this level @ 93,836.01 $
- As long as there is no bullish reversal, we need to treat this bullish move as a correction of the last bearish leg down. Price could react bearish when hitting the 92,215 $ level.
Market Structure Analysis
From a market structure perspective, this Bitcoin daily analysis still treats the weekend price action as a corrective bounce within the prior bearish swing. The daily entry zone has acted as supply, with 4H candles building a head and shoulders right at the top of a rising channel. A clean break of the lower trendline would confirm that buyers are losing control, reinforcing our bearish technical analysis bias. Support resistance interactions are currently more important than precise Fibonacci confluence; for now, Fibonacci plays a secondary role versus the clearly defined horizontal levels around 92,215 $ and the daily high at 93,836.01 $.
Key Levels and Scenarios
Bullish scenario: only a strong break and daily close above 93,836.01 $, followed by a successful retest and defense of this level, would justify shifting to a bullish bias and treating the recent low as a more meaningful bottom.
Key levels to watch:
93,836.01 $ – daily high; must be broken and defended to confirm bullish reversal.
92,215 $ – resistance where price could react bearish within the correction.
Daily entry zone – current supply area repeatedly tagged but not reclaimed.
Rising 4H channel lower trendline – loss of this line supports a move back into lower support zones.
Trading Implications
With no clear momentum shift, short setups around 92,215 $–daily entry zone remain favoured while price stays below 93,836.01 $, whereas aggressive longs are only justified after a confirmed breakout and support hold above the daily high.
This content is for educational purposes only and is not financial advice; always do your own research before making any investment or trading decisions.