


BTC Marketcap / Bitcoin
BTC daily analysis 30/03/2026. Bitcoin is showing a minor bullish reaction from the lower structures of its daily range, but our technical analysis remains cautious as the broader context still leans bearish and the market is at a potential inflection point.
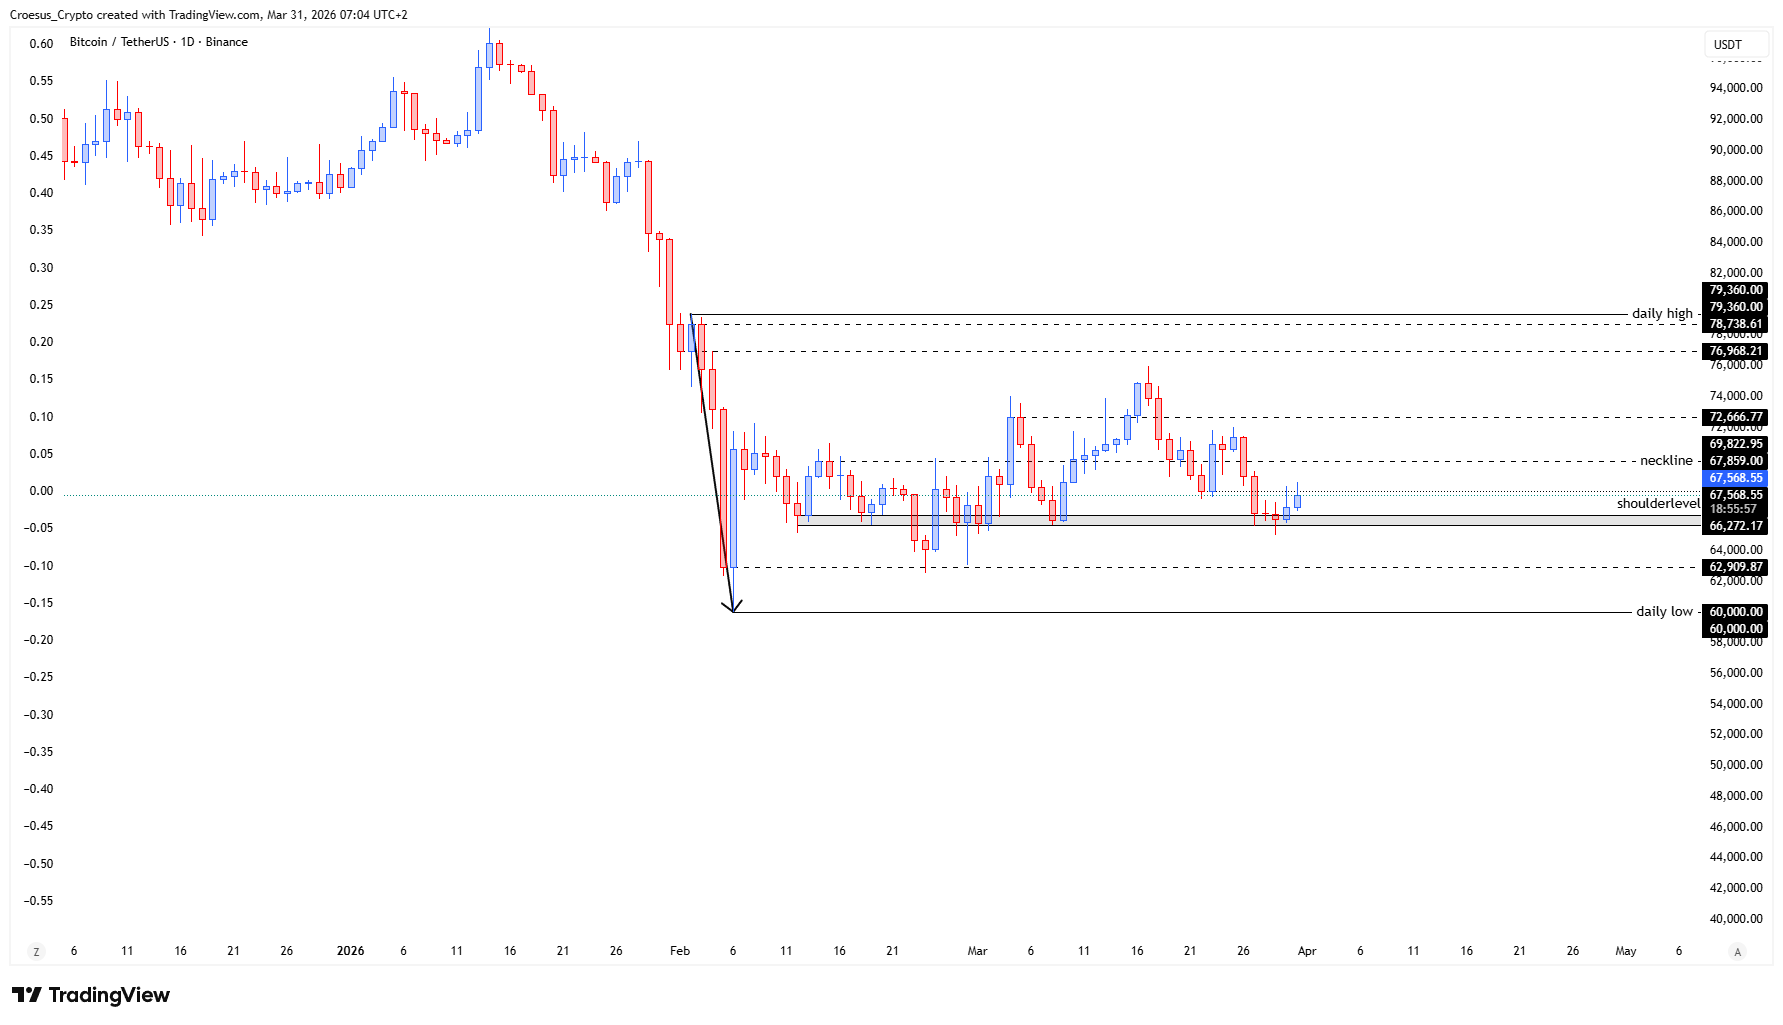
- The BTC price shows us a slight bullish reaction upon hitting the lower structures of the daily range
- We need to stay neutral in every market situation and always evaluate both options :
- Bullish : we keep the current shoulderlevel as support and attack the daily highs again, breaking and closing above those levels
- Bearish : the inverse head and shoulders (iHS) has played completely. Even the -1 level has been hit. We have to take into account that, at this moment, we might see a head and shoulders forming, where out current shoulderlevel becomes our neckline and that our prior fractal high at 72.666,77 $ becomes our HS shoulderlevel.
Market Structure Analysis
From a naked-trading perspective, the key message in this BTC daily analysis is that price is reacting from the lower end of the daily range, but it has not yet proven a structural reversal. The draft notes the inverse head and shoulders (iHS) has played completely and even hit the -1 level, which suggests the prior bullish reversal narrative is potentially exhausted.
When a completed iHS stops producing continuation, the market often transitions into a new corrective structure rather than a clean impulse.
Structurally, that keeps our focus on horizontal support resistance: whether the current shoulderlevel holds as support (range defence) or flips into a neckline area for a possible head and shoulders formation (distribution). The referenced prior fractal high at $72.666,77 becomes the key swing reference if the market indeed starts printing a right shoulder.
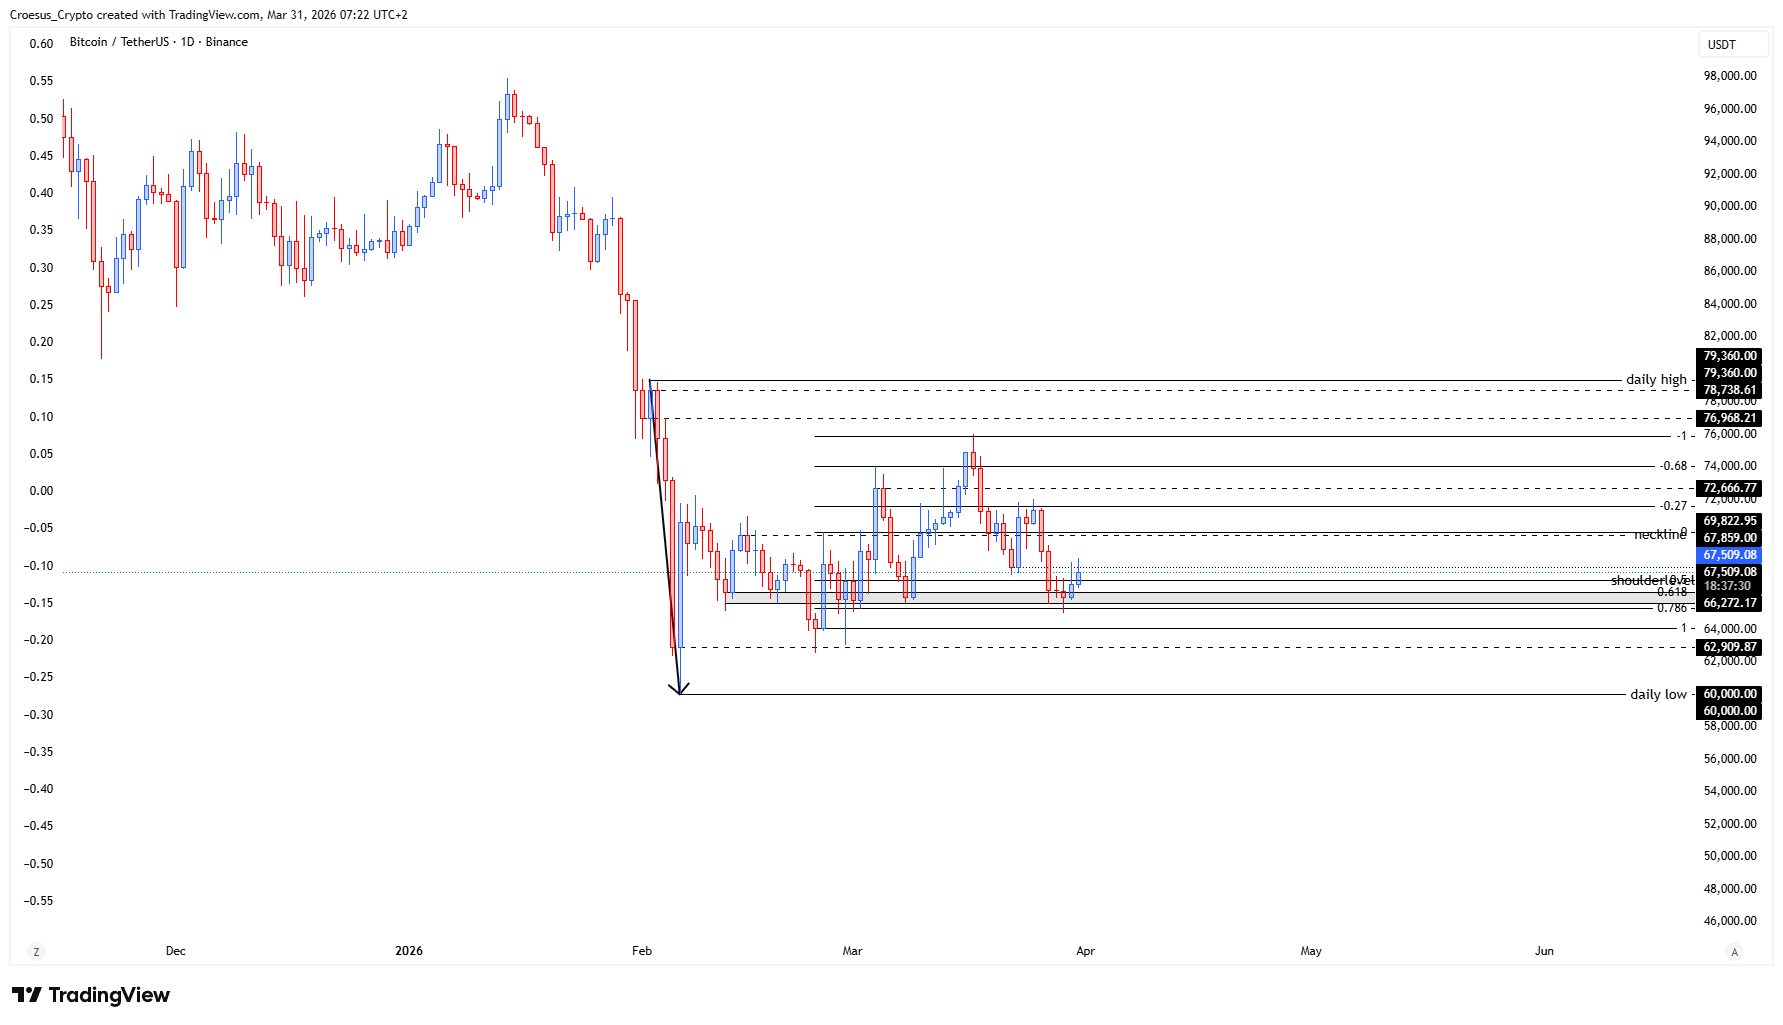
Key Levels and Scenarios
For bulls, BTC daily analysis stays constructive only if the current shoulderlevel continues to act as support and price can reclaim the daily range highs with a break and close above. For bears, failure to hold that shoulderlevel keeps the door open for a head and shoulders structure, where the same zone acts as neckline resistance and selling pressure rotates back into the range.
- Lower structures of the daily range as the current reaction base (support)
- Current shoulderlevel as the key decision level (support vs neckline)
- Daily highs as the breakout and close trigger for bullish continuation
- $72.666,77 as the prior fractal high and potential head and shoulders shoulder reference
This analysis is for informational purposes only and does not constitute financial advice.