


This Bitcoin daily analysis for December 2025 focuses on the sharp rejection from resistance and the completion of a clean head and shoulder structure visible on lower timeframes. Our analysis now favors a bearish bias while we monitor how price reacts around the 86,116 level and potential corrective bounces toward 87K–90K.
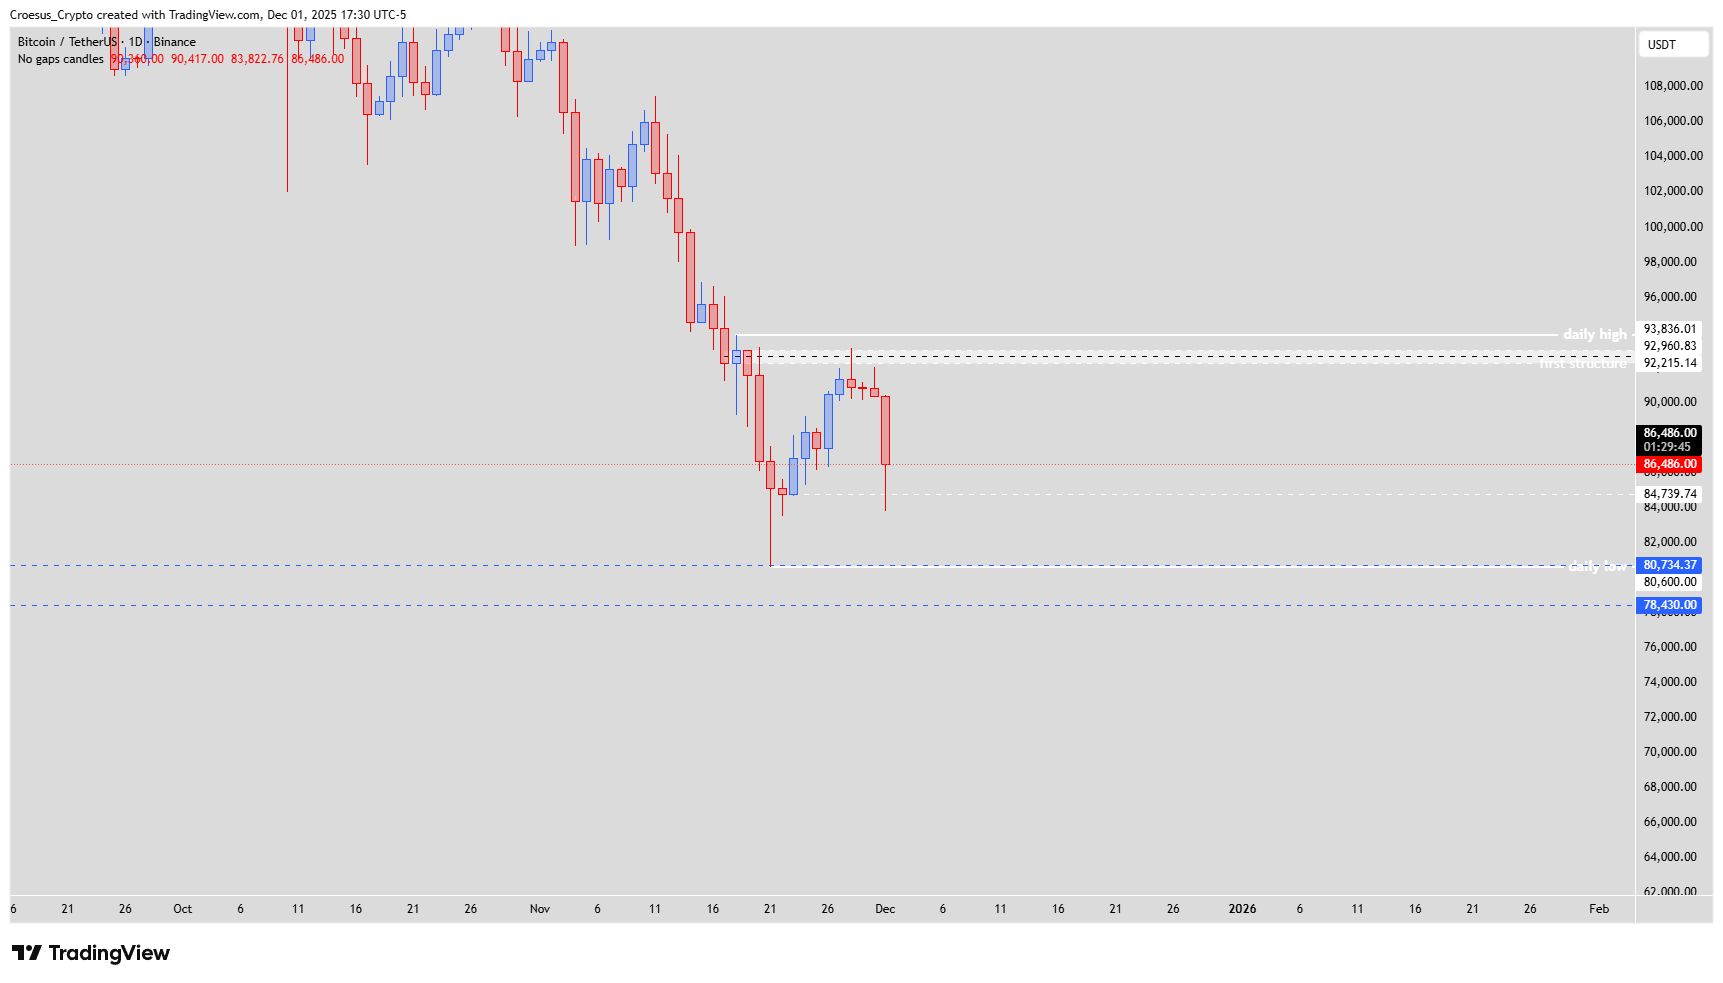
Bitcoin daily chart 01 Dec 2025 highlighting broader downtrend, support around 80,734 daily low and 78,430 major demand.
Trend = bearish ↓
Technical Analysis Key Points
- After the clear rejection on Friday and the inability of the bulls to regain power, price make a clear sell-off today
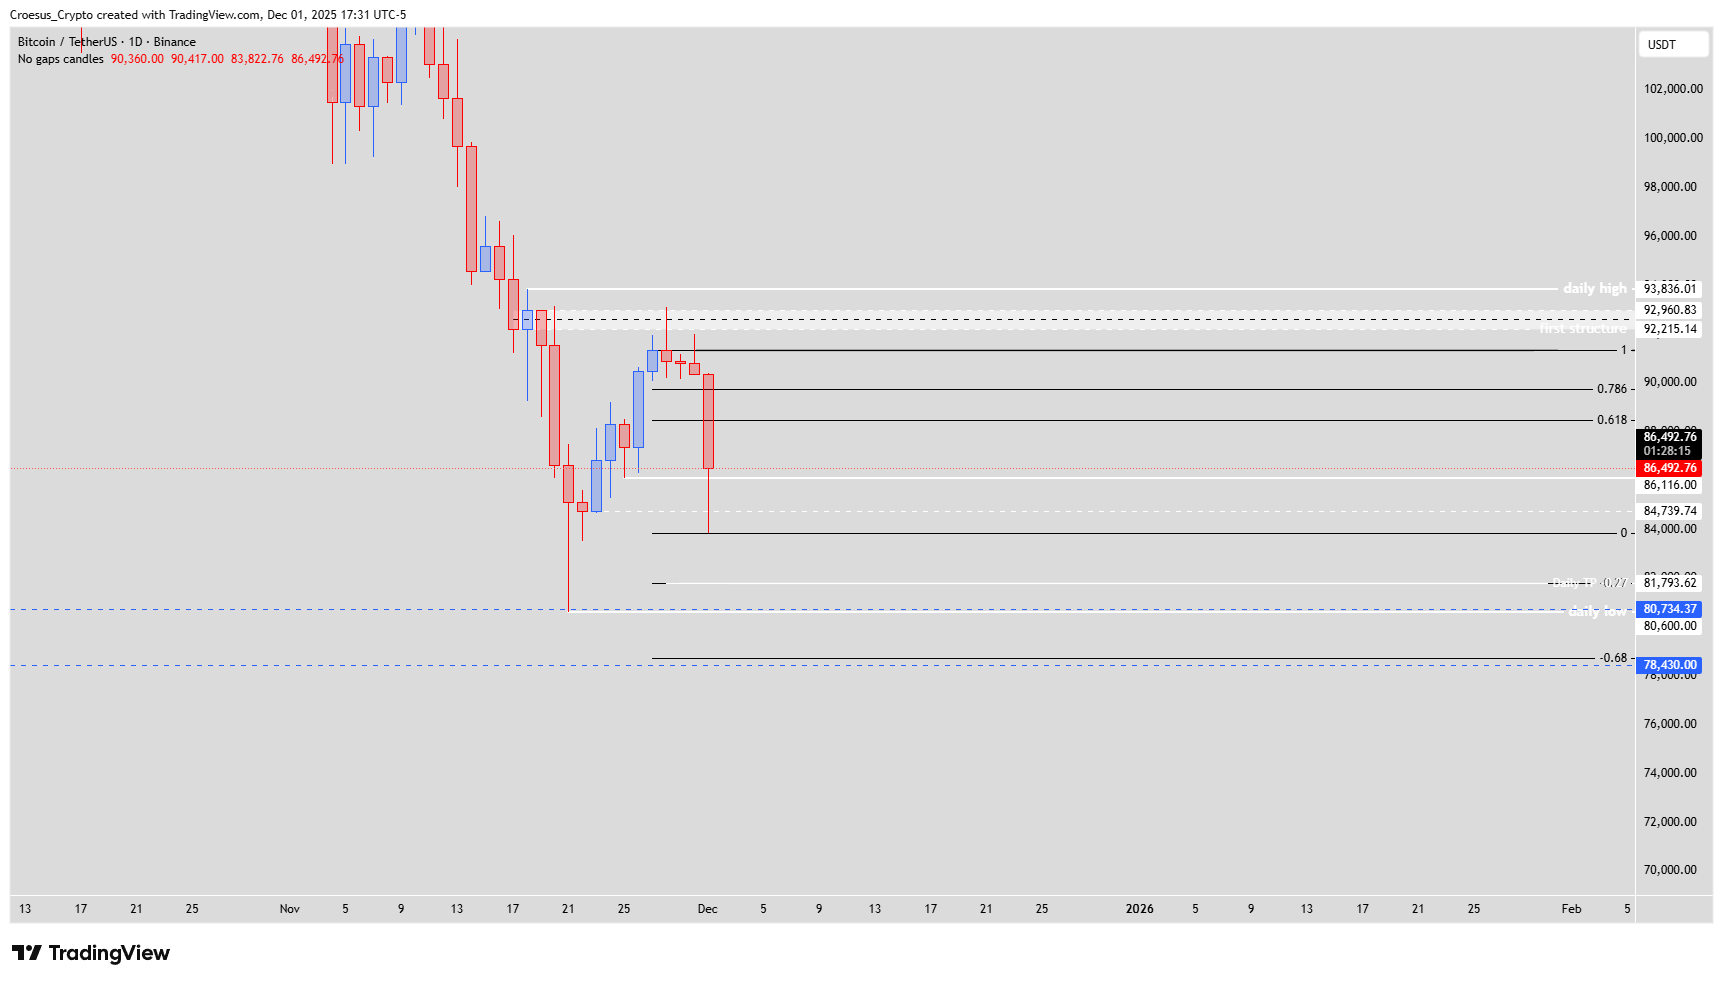
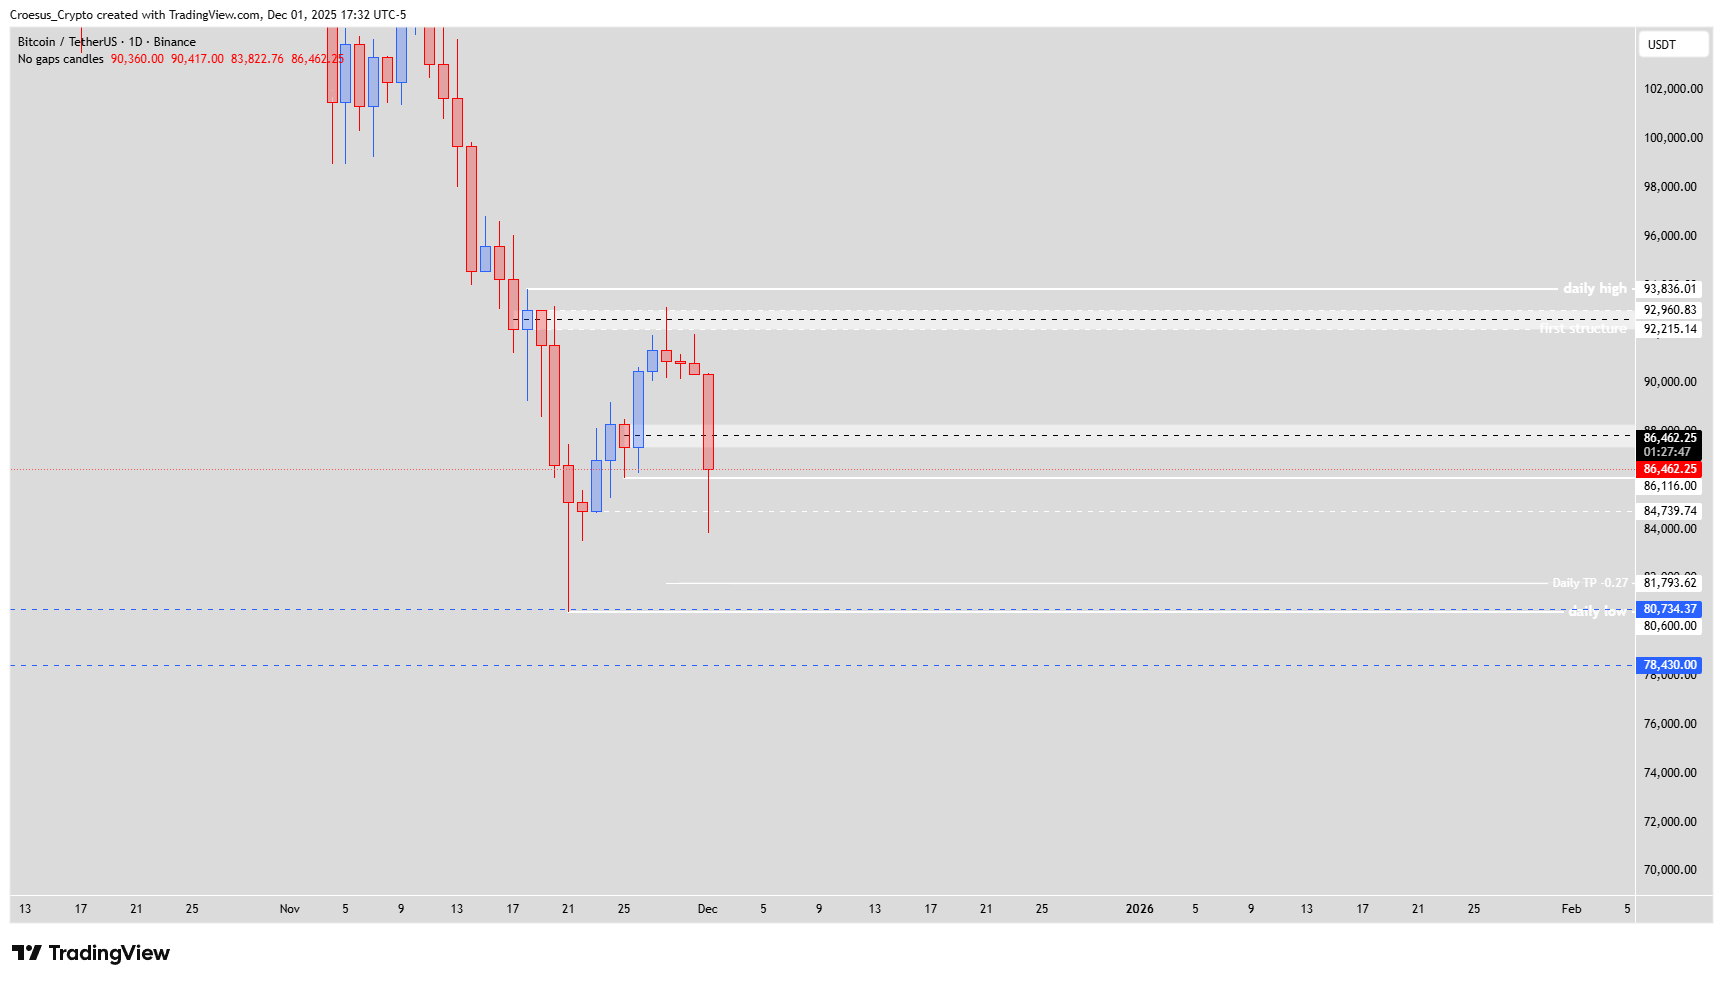
- Price bounced on the 86,116.00 $ level, the swing low of the institutional candle. We see two possibilities of a possible correction of the bearish impulse : either a full reclaim of that candle or the institutional candle will act as resistance, laying down the shoulder level of a head and shoulder pattern.
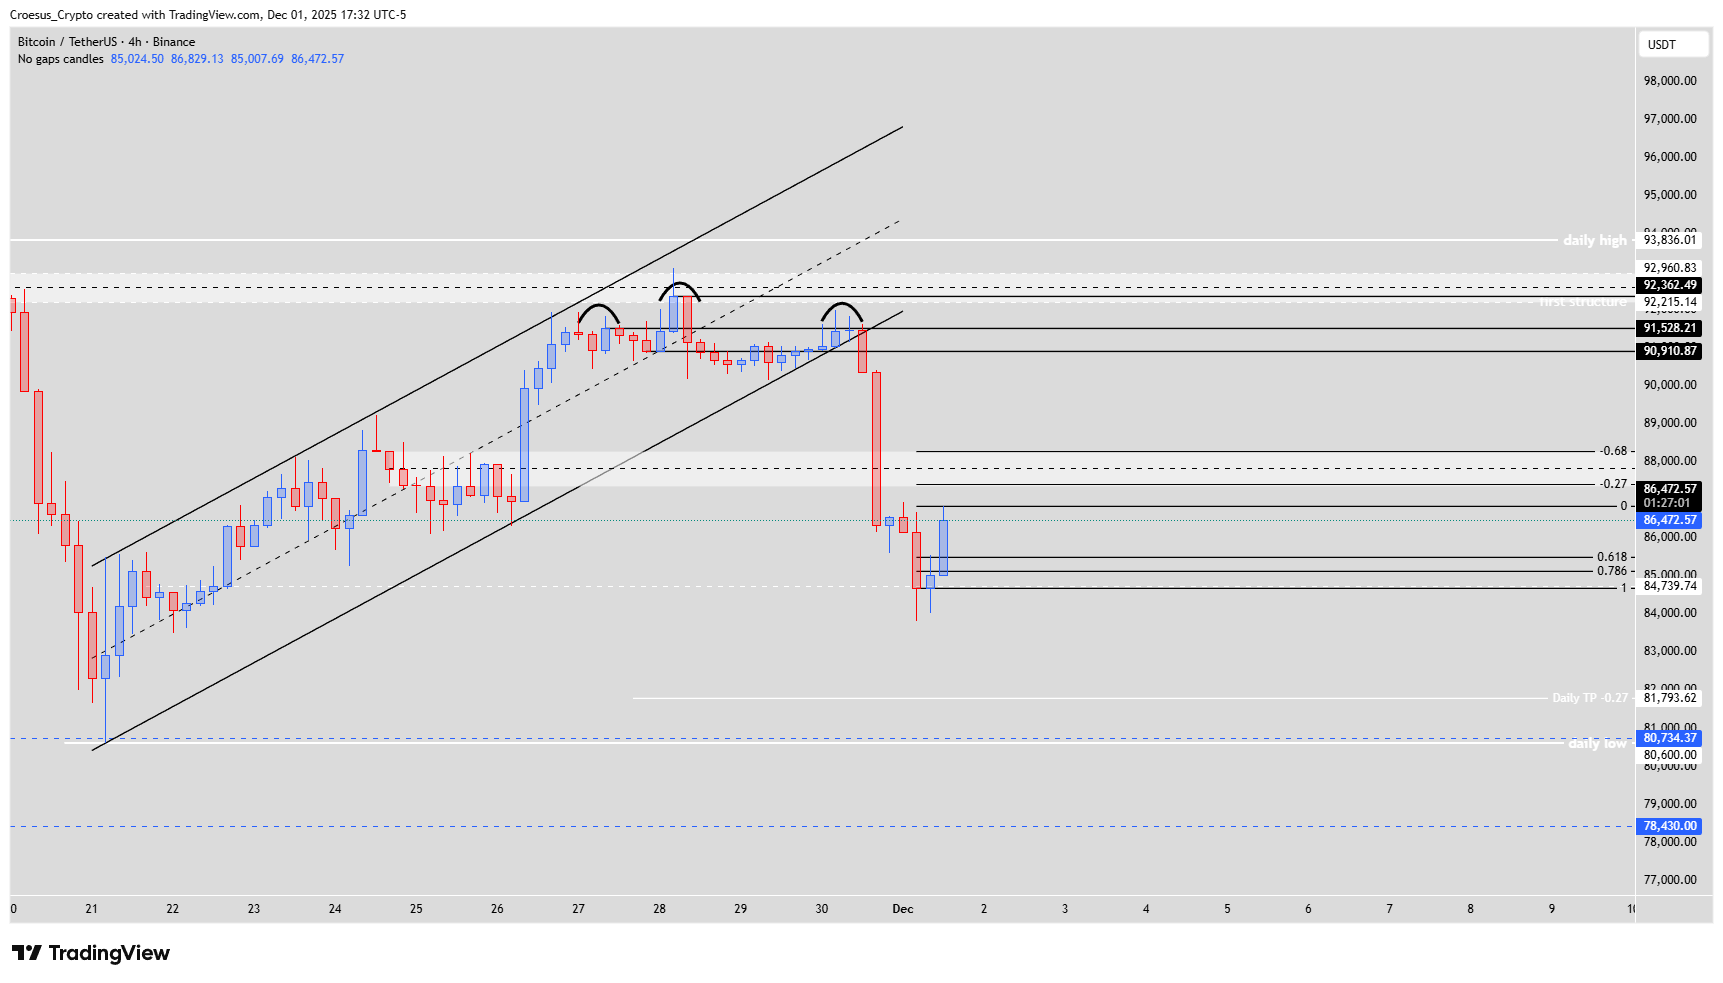
- On the 4H timeframe is clearly visible how the head and shoulder pattern perfectly played out. Once the shoulder 2 was printed and the neckline was broken, price dropped very fast. If price would turn to consolidate, the 87K is a possible zone to retest, but still the 90K (prior lows) is possible.
Market Structure Analysis
In this Bitcoin daily analysis, the rejection of Friday’s highs confirms a strong support resistance flip near the first structure zone. The 4H channel break and completed head and shoulder pattern triggered an aggressive liquidation move, erasing several sessions of grind-up price action in a single impulse. The current bounce from 86,116 – the swing low of the institutional candle – is our key reference; whether price fully reclaims that candle or rejects from it will define the next leg. From a technical analysis perspective, any slow retrace into 87K–90K would likely be corrective within a broader downtrend, while Fibonacci extensions from the recent swing still favor room to the downside.
Key Levels and Scenarios
Bearish continuation scenario: As long as price trades below 90K, we prioritize short setups on corrective bounces, targeting liquidity pockets and lower daily lows.
Levels to watch:
90K: Prior lows and upper boundary of the potential right-shoulder area.
87K: Short-term supply zone if consolidation develops after the dump.
86,116: Institutional candle swing low; pivot for reclaim vs. rejection.
80,734: Marked daily low and first larger downside liquidity pool.
78,430: Deeper support area and major downside objective if selling accelerates.
Trading Implications
For active traders, patience for a structured pullback into 87K–90K offers cleaner short opportunities, with invalidation placed just above local highs and position sizes kept modest relative to portfolio risk.
This content is for educational purposes only and is not financial advice; always do your own research before making any investment or trading decisions.