


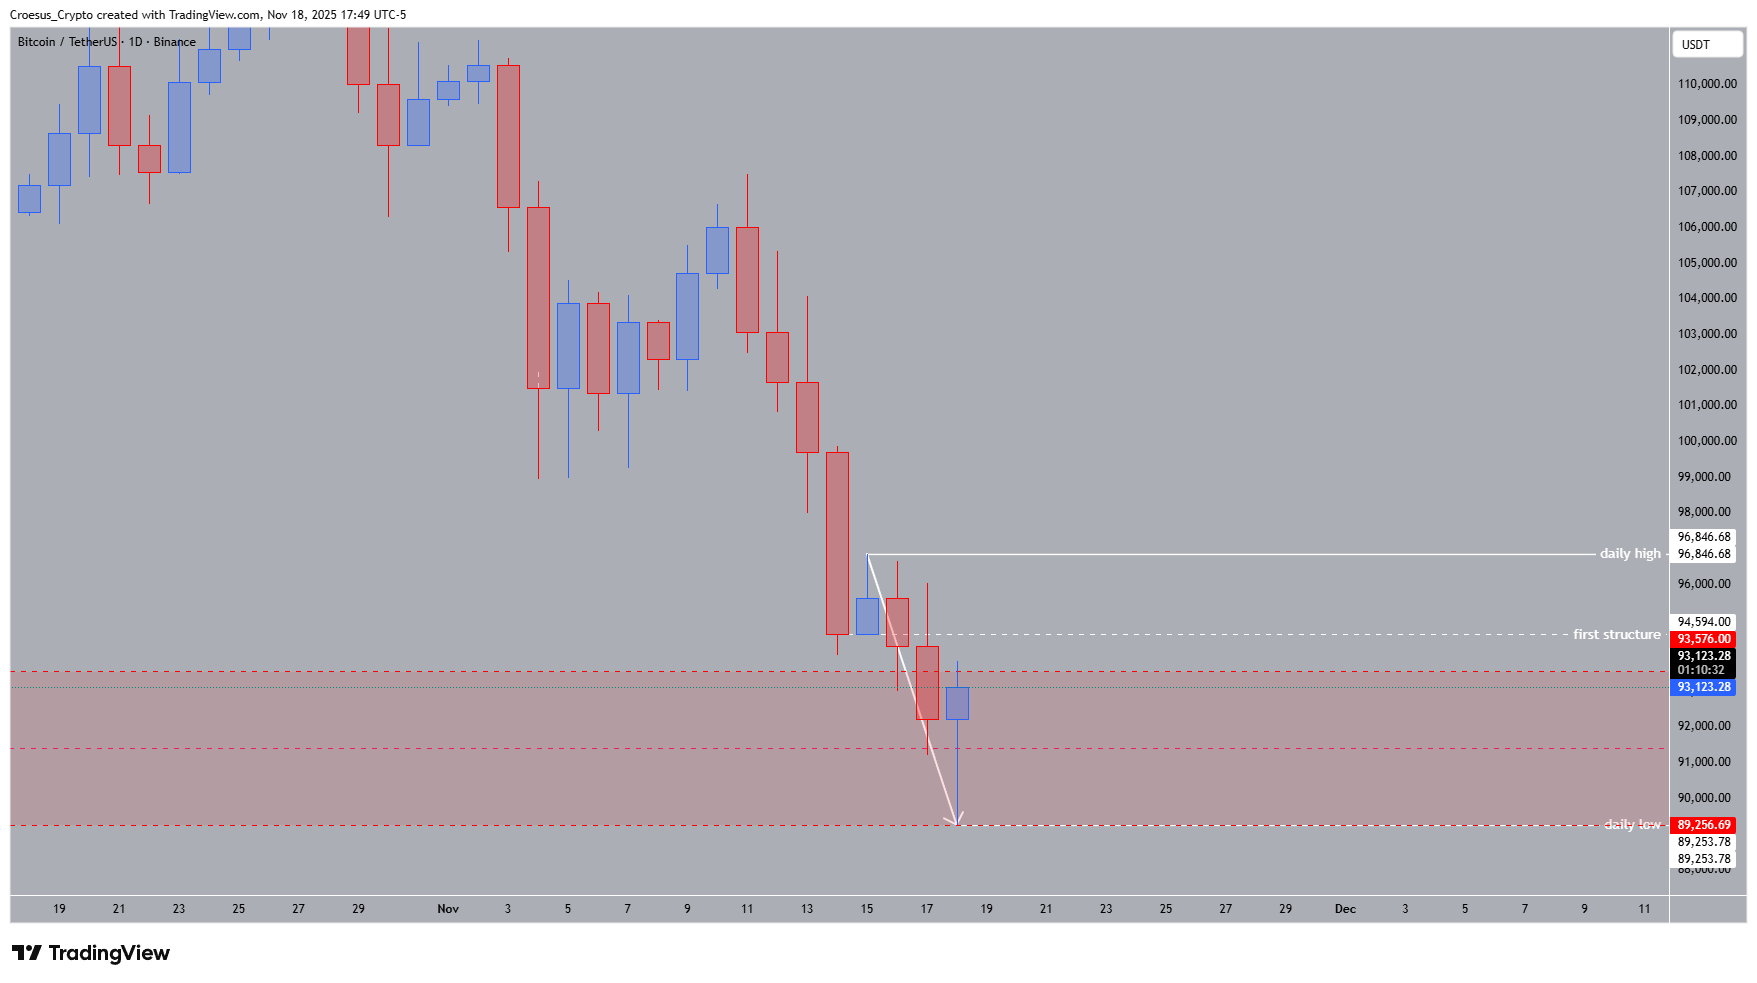
BTC daily chart 2025-11-18 showing monthly liquidity sweep, reactions at daily high/low and key structure levels
- Trend = bearish ↓
- Daily high =96.846,68$
- Daily low = 89.253,78 $
- Technical Analysis Key Points
- At the beginning of the day price retested and swept the low of the monthly liquidity zone (monthly inverse head & shoulder).
- Afterwards price retested the high of the monthly liquidity zone.
- Eventhough we see a bullish reaction upon touching this monthly keylevels, the trend remains bearish. We need to break the daily high @ 96.846,68 $.
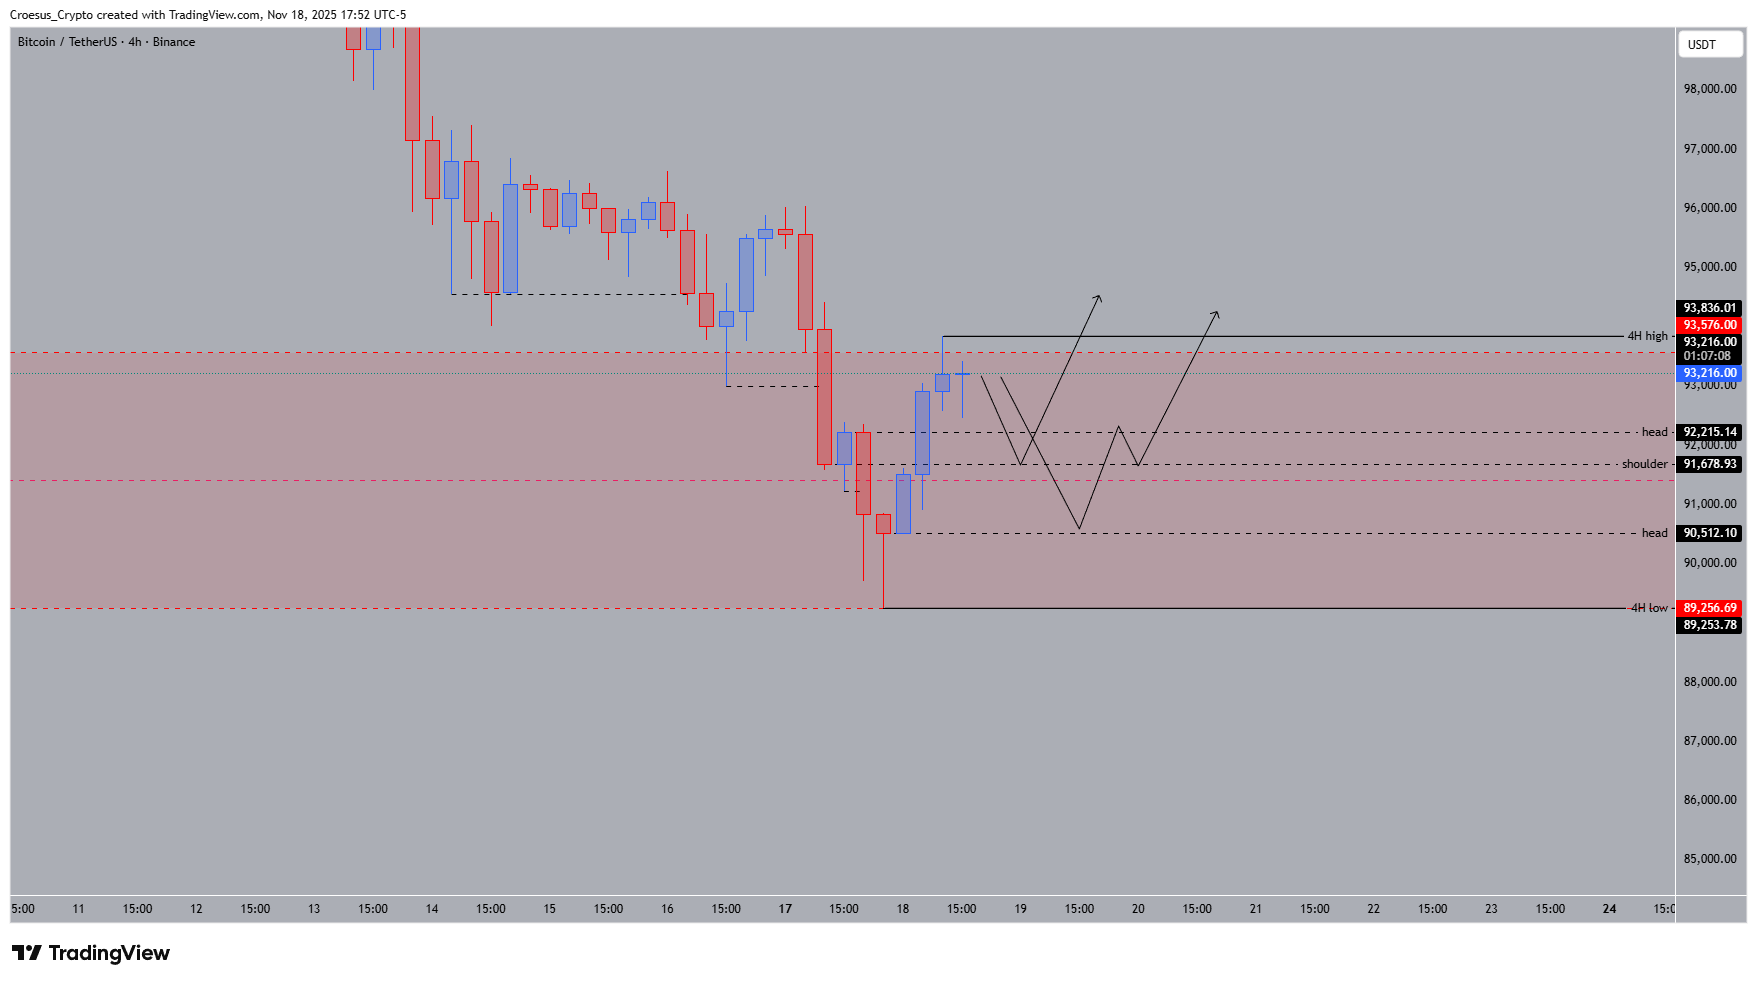
- If we zoom in on the 4H chart, we can see a reversal pattern, a inverse head and shoulder with a break of structure. Here we have two possibilities : either we retest the shoulder and continue bullish either we retest the head and print a double bottom. Either way this could be an early sign of reversal.
- The trade on the 4H could be taken, but be aware that the risk remains high. We have seen a drop of 30% in the last two months. For longer term trades I would like to see a confirmation on the daily time frame.
- Patience remains key !
BTC 4H chart 2025-11-18 showing inverse head & shoulder, break of structure and potential retest scenarios
Market Structure Analysis
Our BTC daily timeframe analysis highlights how price swept the lower boundary of the monthly liquidity zone, tapping the “inverse head & shoulder” liquidity before moving back up to retest the zone’s upper boundary. This confirms the zone’s relevance but does not invalidate the prevailing bearish trend. For a structural shift, bulls must reclaim the daily high at 96,846.68 $, which currently acts as the primary resistance and the invalidation level for further downside continuation.
The rejection wicks on the retest show demand stepping in, but market structure remains oriented toward lower highs and lower lows on the daily. This keeps BTC in a corrective state despite the short-term bullish reaction.
On the 4H chart, technical analysis reveals a cleaner reversal pattern: an inverse head and shoulder with an initial break of structure. Whether price retests the shoulder (bullish continuation) or returns to the head to form a double bottom, both scenarios indicate a potential early reversal attempt—but not yet a confirmed one on the higher timeframe.
Key Levels and Scenarios
Bullish scenario (early, unconfirmed)
A 4H continuation could push BTC toward the daily high with +3–5% upside potential, but validation only occurs if that high breaks.
Critical levels to watch
96,846.68 $ – Daily high: Break needed to reverse trend
94,594 $ – First structure: Initial resistance
91,678 $ – Shoulder retest: Bullish continuation trigger
90,512.10 $ – 4H head zone: Key reaction area
89,253.78 $ – Daily low: Major downside liquidity
Trading Implications
4H offers a tradeable structure, but risk remains elevated after a 30% drawdown. Higher-timeframe confirmation is required for swing positions.
This analysis is for educational purposes only and not financial advice.