


BTC Marketcap / Bitcoin
BTC daily analysis 09/02/2026. Bitcoin is trading in a bearish structure on the daily timeframe, with the latest corrective bounce stalling into a broken support zone that is acting as resistance.
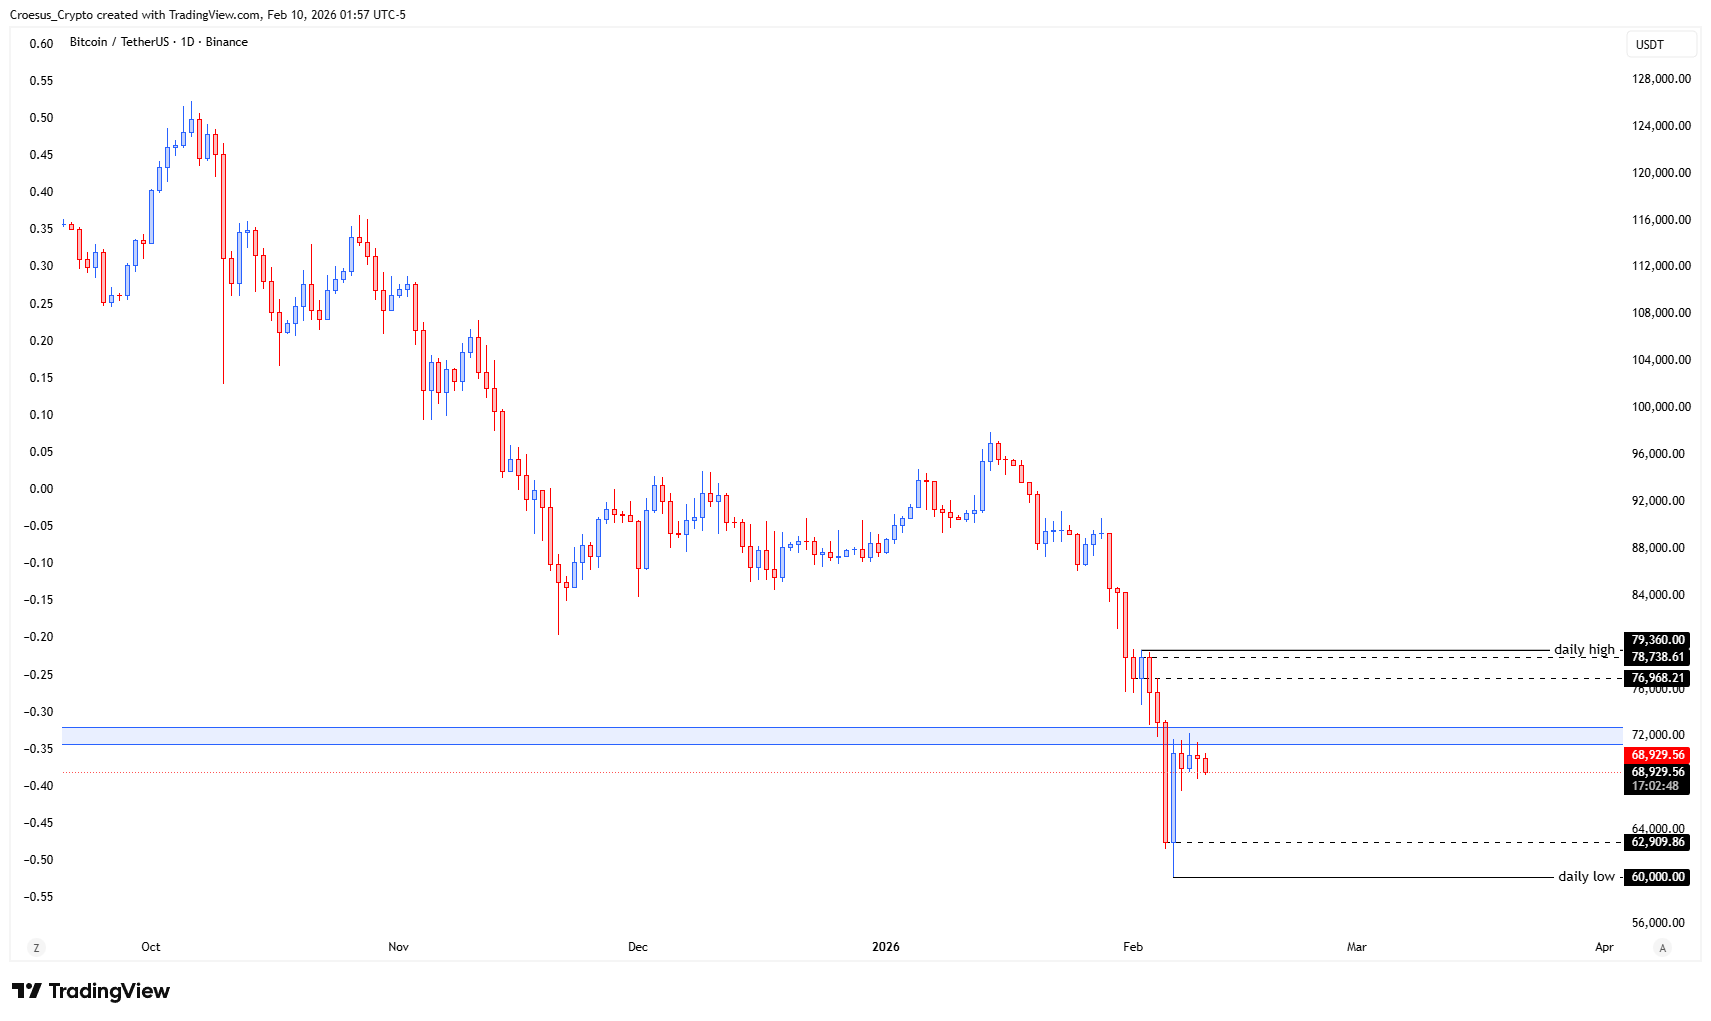
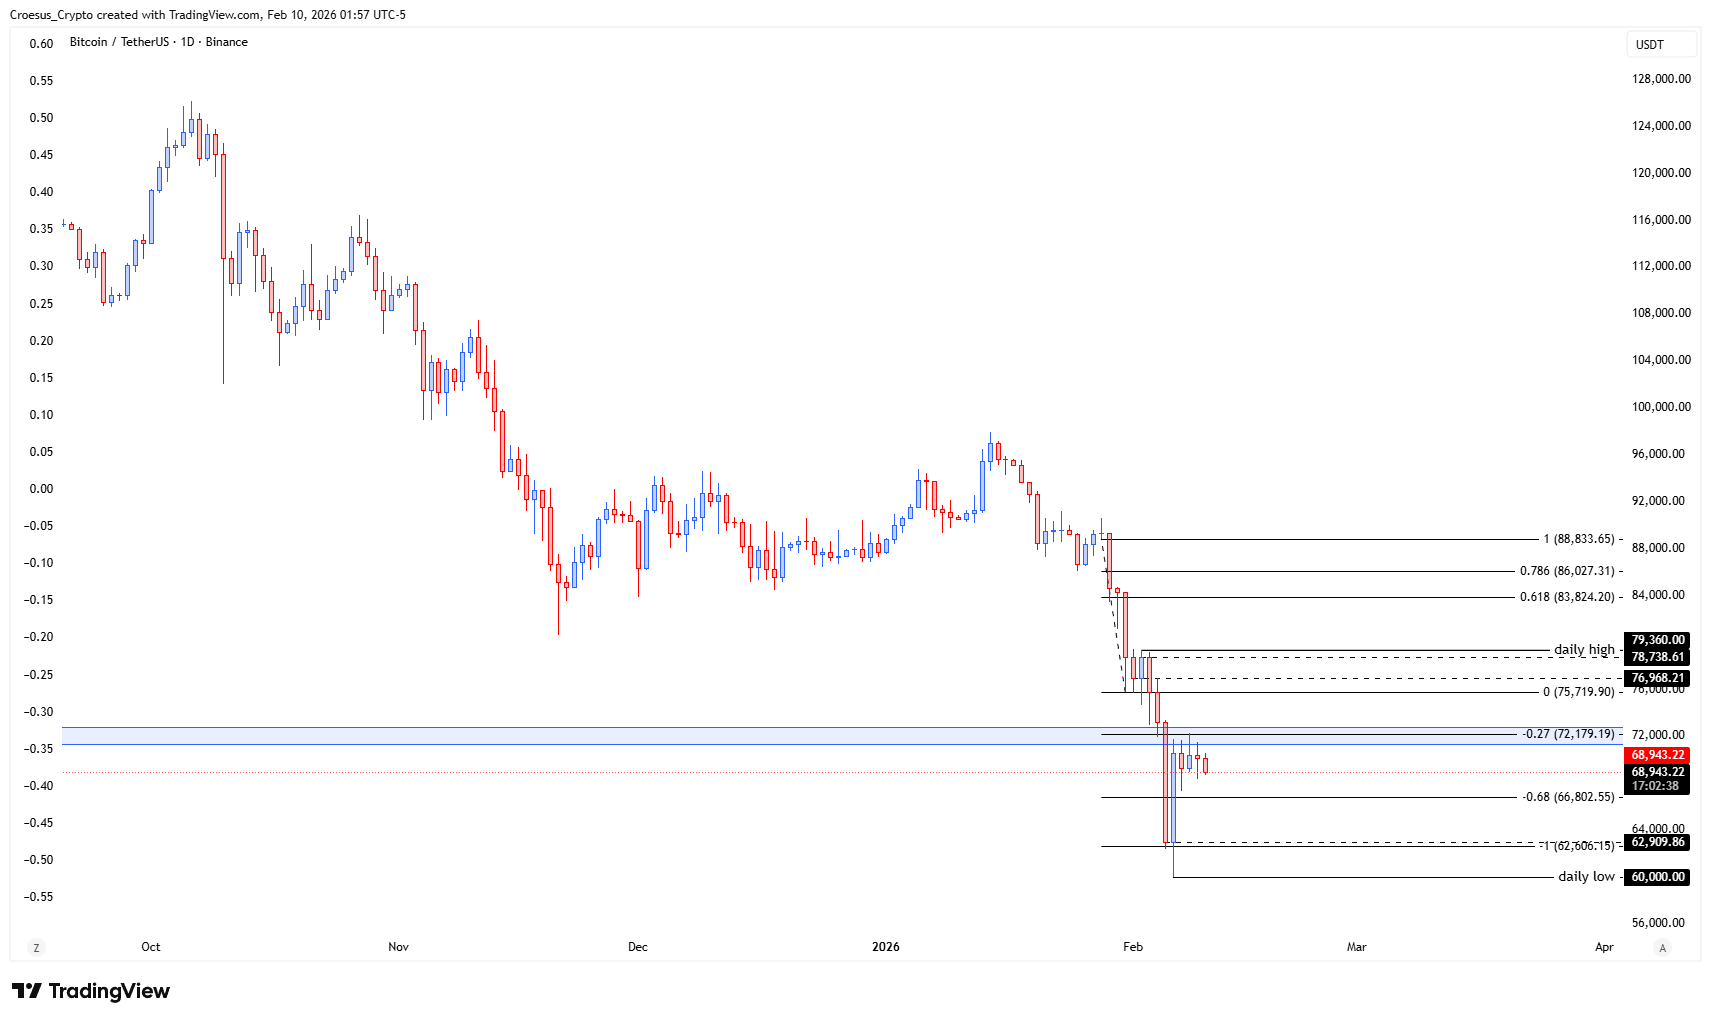
- Keeping up with the TOTAL chart : we saw the price making a bullish corrective move, but the move was capped by a broken weekly support zone that flipped into resistance.
- This could be an ABC-correction, where we first revisit the lows again, in order to see a larger bullish correction towards the daily highs.
- But it also could be a simple bearish W, because the fib 0.618 retracement level has been activated
Market Structure Analysis
Our BTC daily analysis focuses on the support resistance shift created by the broken zone overhead. Even though the observation references a “broken weekly support zone,” the chart context here is daily, and the key takeaway remains the same: the corrective leg is capped into prior structure, suggesting sellers are defending that area as supply.
In a bearish PHASE 4 environment, impulsive downside legs are often respected until the market can reclaim and hold former support, so a failed reclaim keeps the continuation bias intact.
Structurally, price is balancing two paths from the notes:
- an “ABC-correction” where the market revisits the lows first before attempting a broader corrective push toward the daily highs, versus a simpler bearish continuation (“bearish W”) where the activated Fibonacci 0.618 retracement acts as a sell-zone within the larger down move. Until price shows acceptance back above the lost level, the market structure remains vulnerable to lower lows.
Key Levels and Scenarios
In this BTC daily analysis, bearish continuation stays the base case while price trades below the broken support and corrective rallies are rejected. A continuation becomes more likely if a retest confirms that zone as resistance. The alternative scenario requires a reclaim and hold above the lost level to begin shifting structure from continuation into recovery.
- Broken support zone: current decision point; risks acting as resistance if rejection holds
- Retest/rejection area: defines bearish control on corrective rallies
- Reclaim and hold zone: required to invalidate the immediate continuation structure
- Prior lows: downside structure area the ABC path would revisit first
- Fibonacci 0.618 area: activated retracement zone that can align with seller defense
Trading Implications
Risk is elevated around this decision area because both outcomes are plausible on the daily chart: rejection keeps continuation in play, while a clean reclaim can force shorts to cover and shift the support resistance map. Conservative approaches typically wait for daily confirmation (rejection vs reclaim and hold), while aggressive approaches often engage on the first retest, accepting higher whipsaw risk.
This analysis is for informational purposes only and does not constitute financial advice.