

BTC Marketcap / Bitcoin
BTC monthly analysis January 2026. Bitcoin is trading in a high-timeframe decision zone after a full retrace of the prior impulse, creating a “fake-out” environment where both long and short narratives compete around key horizontal support resistance.
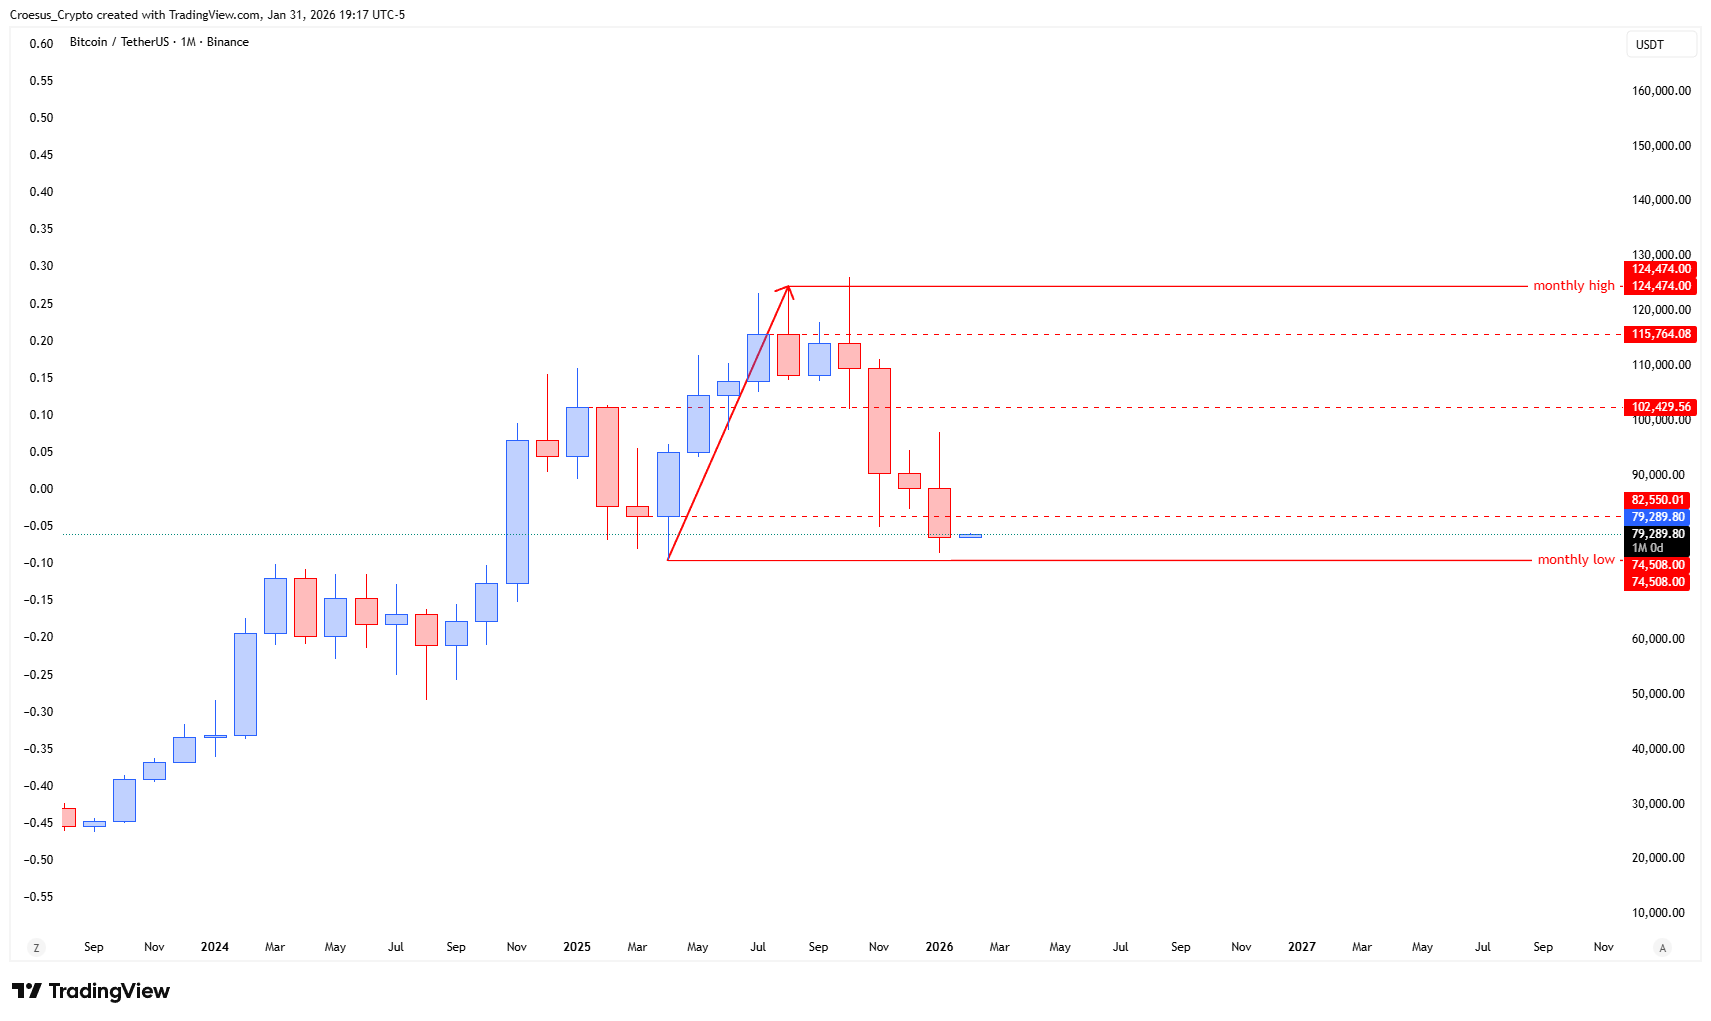
- After the bullish impulse from $74.508,00 to $124.474,00 $ we saw price correct this impulse completely.
- Price is at this moment inside the fake-out, pushing investors into doubt wether to take long set-ups or short set-ups
- At this moment is the $74.508,00 the line in the sand : a monthly close below this level shift our mindset to bearish. A sweep of that low inside the month can happen, but the close is decisive.
- Until then we keep looking for long set-ups on the lower timeframes.
Market Structure Analysis
From a market structure perspective, BTC printed a strong impulsive move from the 74,508 monthly low into the 124,474 monthly high, then corrected that leg back into the fib 100%. The subsequent sell-off pushed below the marked shoulder level, but it held above the head, shifting this from a clean breakout-and-retest into a deeper retest that keeps the broader structure technically intact.
In Croesus terms, our BTC monthly analysis remains framed as a PHASE 1 corrective structure within a larger bullish leg as long as the head continues to hold while support resistance flips are tested. Fibonacci can be overlaid on the full low-to-high impulse as a supporting tool, but the key decision points remain the horizontal neckline band, shoulder zone, and head support.
Key Levels and Scenarios
For the bullish scenario, BTC needs to continue defending the head at 82,550, then reclaim the shoulder area near 90,509 to reduce the current “fake-out” pressure. A sustained monthly close back above the first structure / neckline at 102,429–110,246 would signal renewed momentum and reopen the path toward the 124,474 monthly high. For the bearish scenario, a clean monthly close below 82,550 shifts structure bearish and increases the probability of a liquidity run into 74,508; a breakdown there would confirm higher-timeframe failure. This BTC monthly analysis therefore hinges on monthly closes, not intramonth wicks.
- $124,474 – monthly high / major resistance
- $110,246–$102,429 – first structure / neckline resistance band
- $90,509 – shoulder region acting as intermediate resistance
- $82,550 – head support and primary bullish invalidation
- $74,508 – monthly low and line in the sand on a closing basis
Trading Implications
While this corrective phase persists, positioning is structurally cleaner when aligned with the head holding as support, with more conservative confirmation coming from a monthly reclaim of the neckline band. If monthly acceptance occurs below the head, risk shifts toward trend reversal conditions rather than dip-buying.
This analysis is for informational purposes only and does not constitute financial advice.