

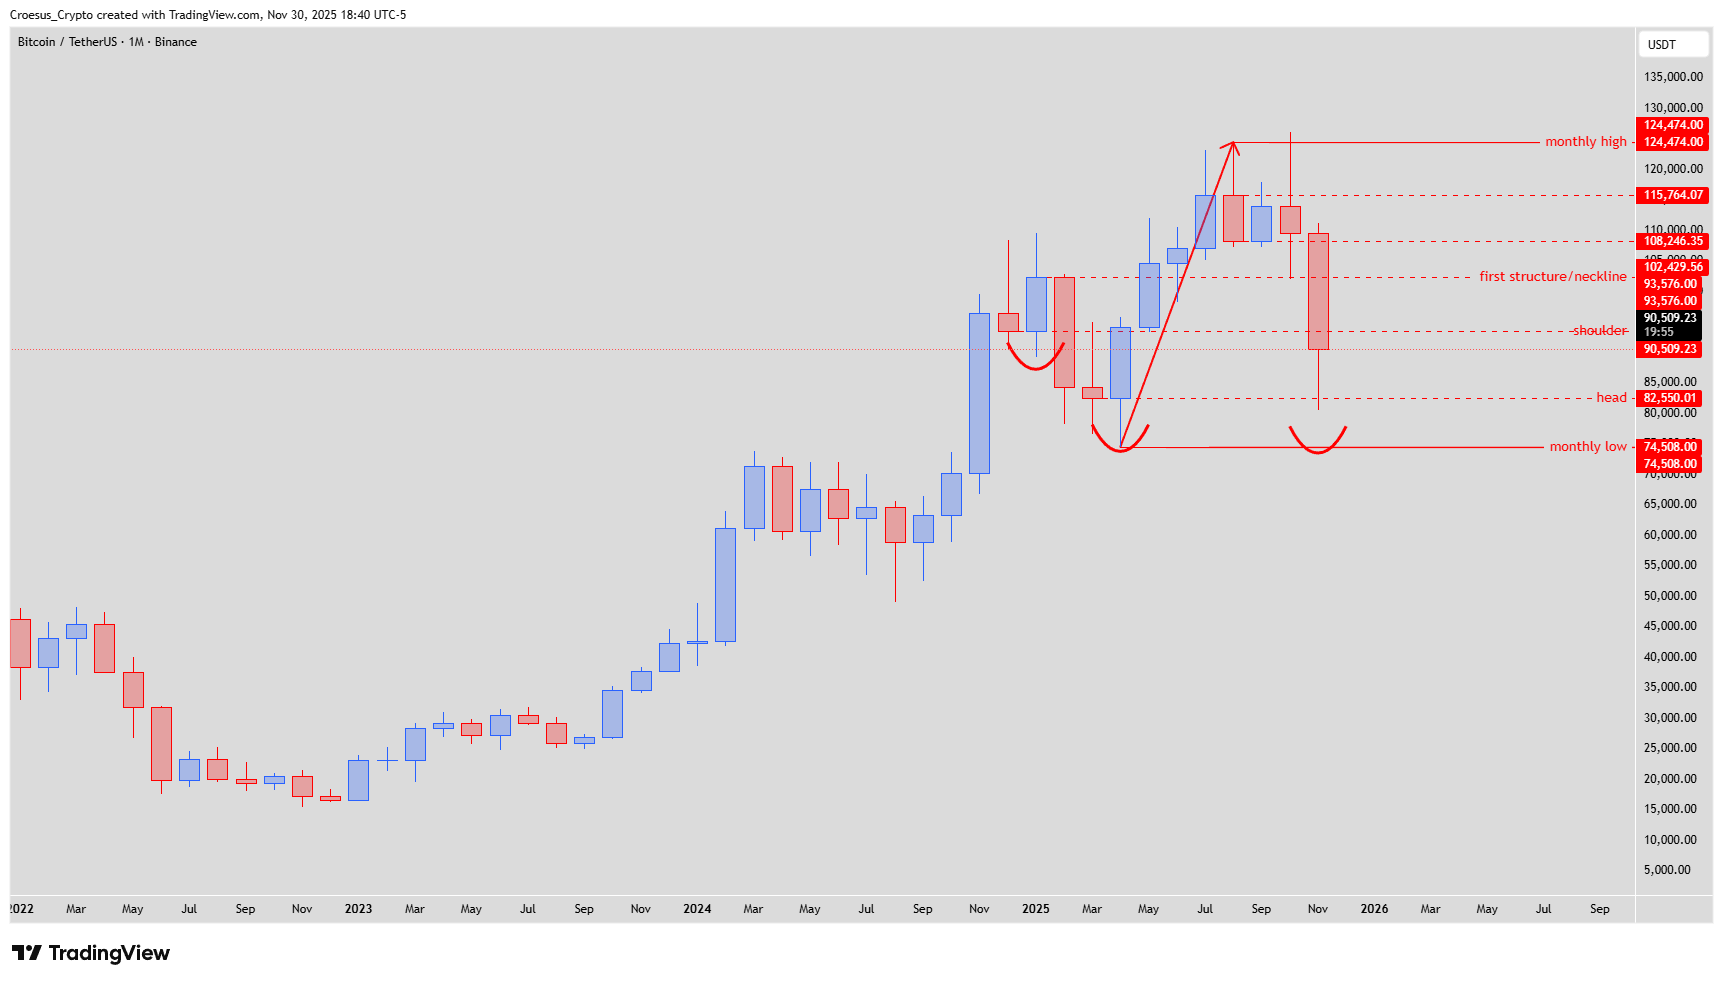
In this Bitcoin monthly analysis we focus on the large inverse head and shoulders pattern that has been driving the current cycle. November’s candle extended the correction from the 124,474 $ monthly high and briefly broke below the right-shoulder area, but crucially still respected the head support around 82,550 $. That keeps the higher-timeframe bullish reversal pattern intact for now, even as price remains in a corrective phase.
Bitcoin monthly chart Nov 2025 with inverse head and shoulders structure, shoulder and head support levels, first structure neckline and monthly high/low levels.
Technical Analysis Key Points
Price failed to hold the shoulder level of the inverse head and shoulder, but still respected the head and thus the inverse head and shoulders pattern remains intact for now.
The first structure / neckline area sits around 102,429–110,246 $, capping the last impulse and now acting as key resistance.
The right “head” low near 82,550 $ aligns with the current corrective low and remains the key bullish invalidation level.
The unswept monthly low around 74,508 $ is the final downside level before the pattern breaks structurally.
Market Structure Analysis
From a structural perspective, BTC printed an aggressive impulse from the 74,508 $ monthly low into the 124,474 $ monthly high, then pulled back into the head region before launching into the current shoulder zone. November’s sell-off broke below the marked shoulder level but stopped above the head, turning this into a deeper-than-ideal retest rather than a clean pattern failure. In Croesus Crypto terms, we are still in a Phase-1 correction of a larger bullish leg, as long as the head continues to hold as support resistance flips are tested from above.
Traders may overlay Fibonacci retracements on the full low-to-high impulse, but the main decision points remain the horizontal levels: neckline, shoulder band and head support.
Key Levels and Scenarios
Bullish scenario:
Bulls want to see the head at 82,550 $ continue to hold, followed by a grind back above the shoulder area near 90,509 $.
A sustained monthly close back over the first structure / neckline at 102,429–110,246 $ would confirm renewed momentum and reopen targets toward the 124,474 $ monthly high and beyond.
Bearish scenario:
A clean monthly close below 82,550 $ (head) would invalidate the inverse head and shoulders and signal a stronger trend shift.
In that case, the market likely seeks liquidity at the 74,508 $ monthly low, and a breakdown there would confirm a full higher-timeframe reversal, forcing us to remap the cycle with lower extension targets.
Key levels to watch
124,474 $ – monthly high / major resistance.
110,246–102,429 $ – first structure / neckline resistance band.
90,509 $ – shoulder region now acting as intermediate resistance after failing as support.
82,550 $ – head and primary bullish invalidation.
74,508 $ – monthly low and final downside support before structural failure.
Trading Implications
Within this corrective phase, Croesus Crypto positioning favours cautious accumulation only while the head holds, with tighter risk below 82,550 $, and more aggressive trend-following longs reserved for a confirmed monthly reclaim of the neckline.
This analysis is for educational purposes only and is not financial advice or a recommendation to buy or sell any asset.