BTC Marketcap / Bitcoin
Bitcoin weekly analysis Week 11 2026. BTC is printing a corrective rebound inside a larger bearish structure, with price showing stronger weekly closes while still trading into clearly defined support resistance overhead.
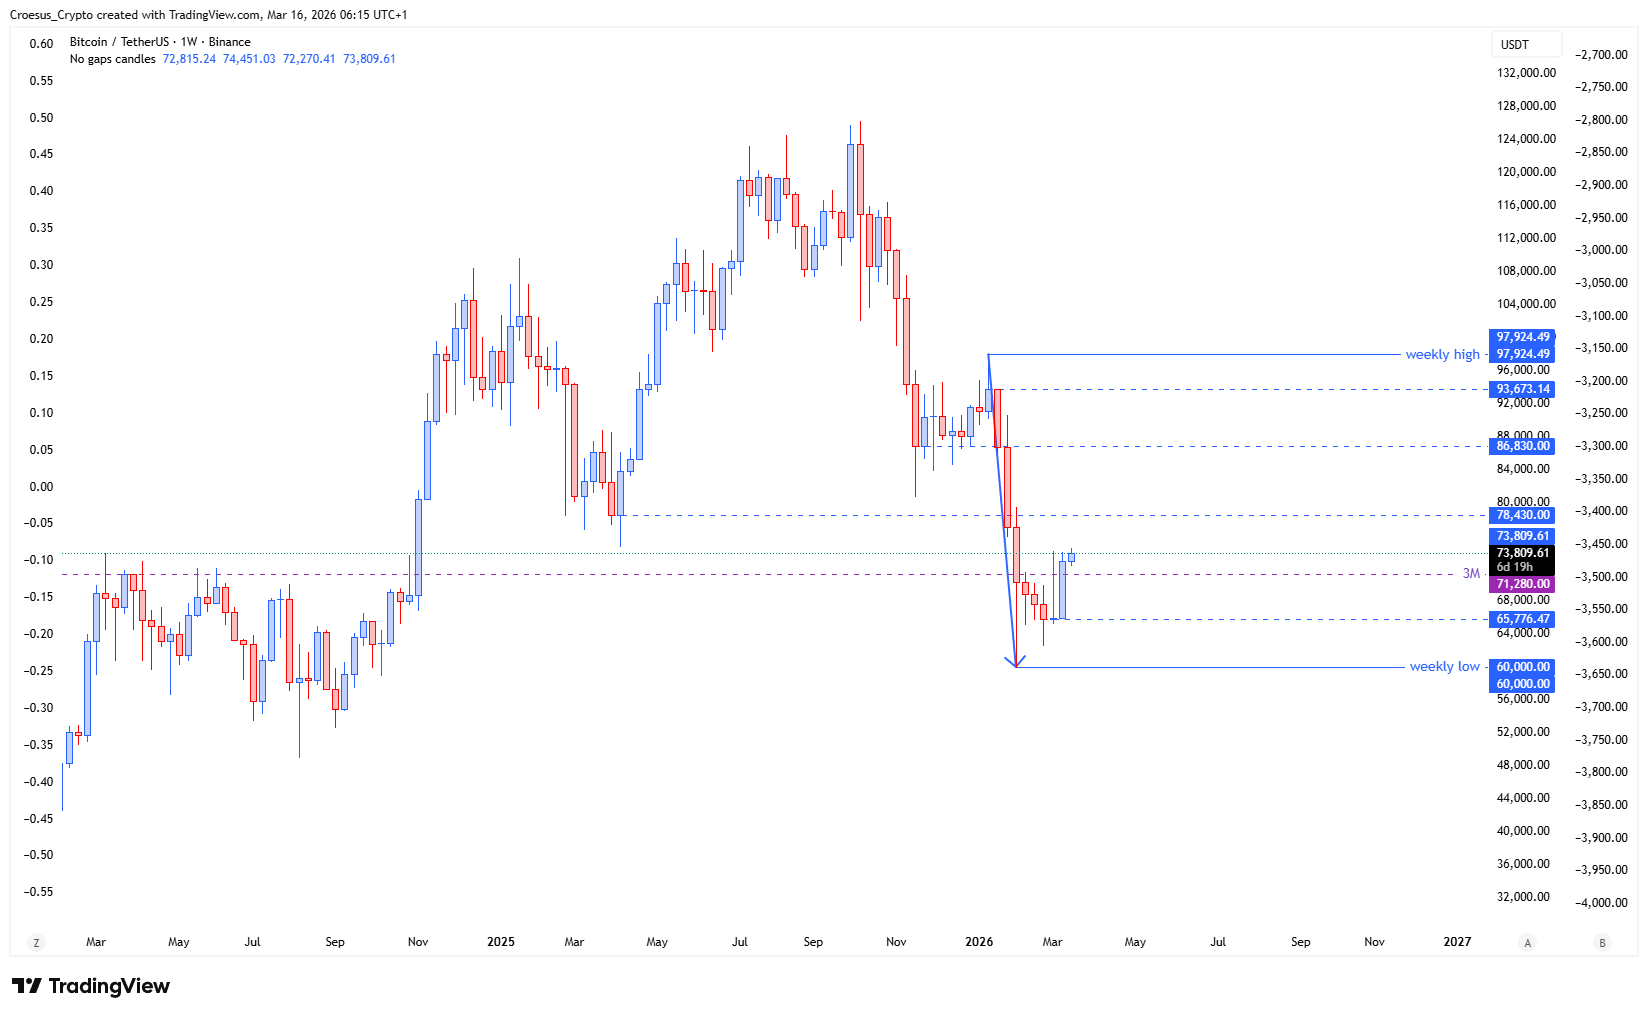
- BTC shows us that price pushed the same distance up as the week before but managed to close at the high of the candle.
- Price also managed to break and close above a 3M level.
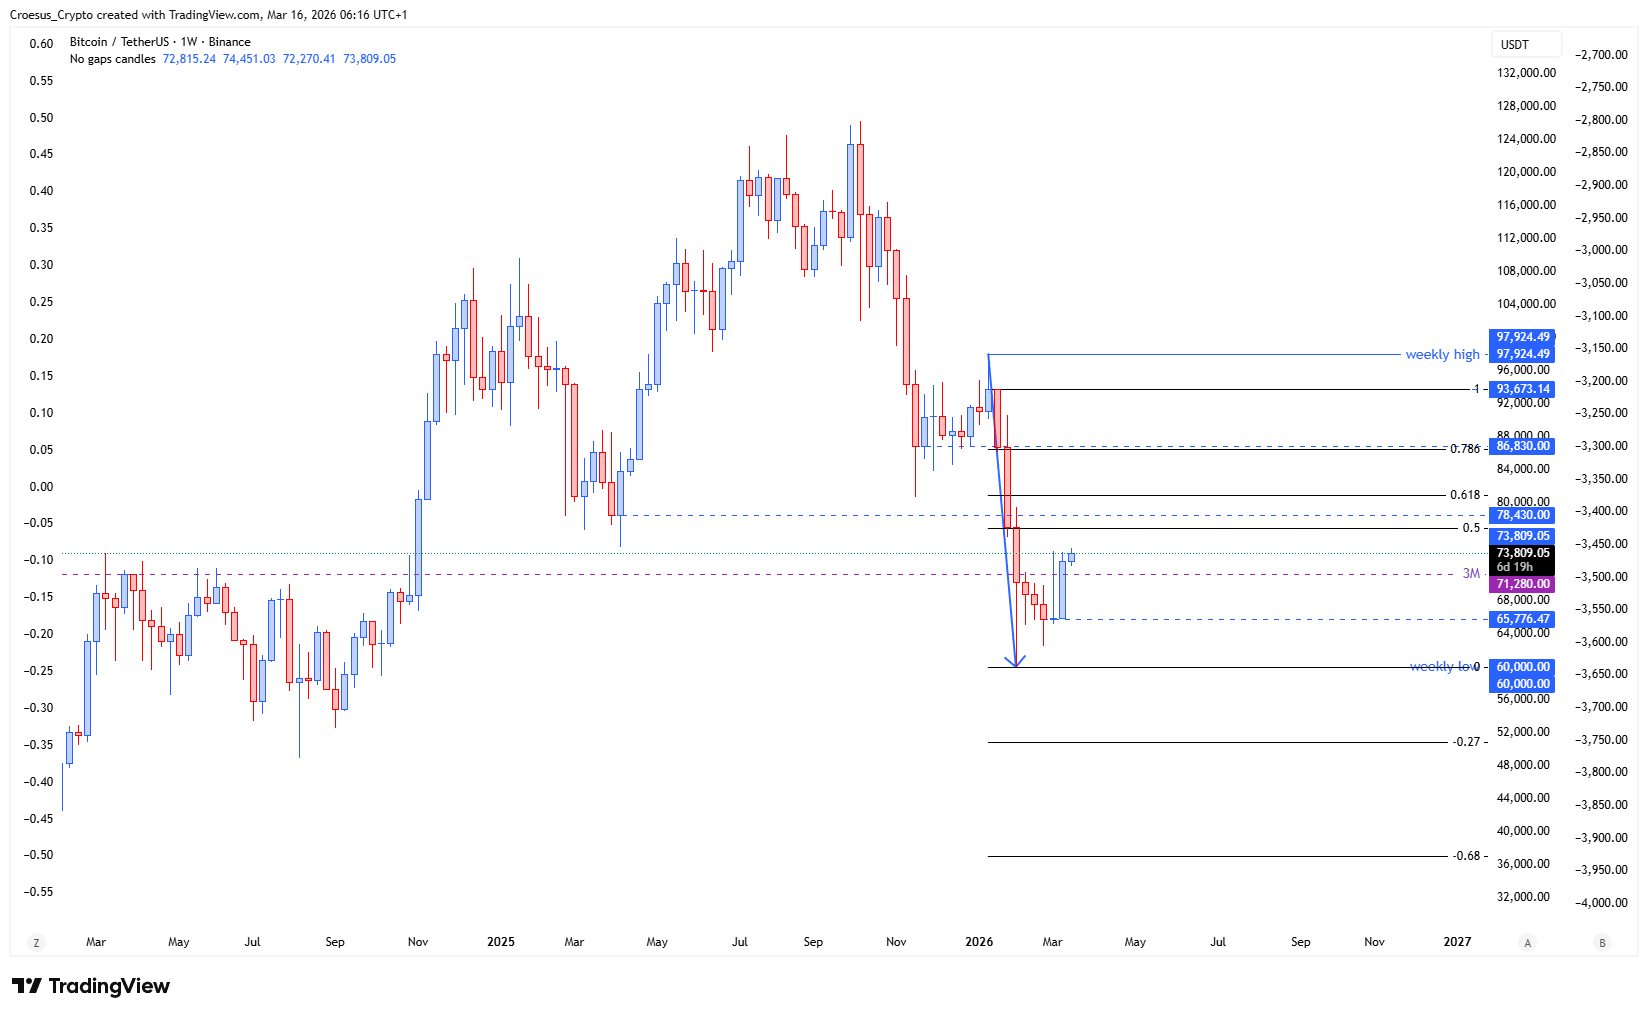
- This move up is still a bullish corrective move of the larger bearish impulse. Resistance levels are met at 78.430,00 $ (prior low) and 86.830,00 $ (prior lows of range that initiated the bearish impulse).
Market Structure Analysis
From a market structure perspective, our Bitcoin weekly analysis still frames the advance as a counter-trend leg: price is moving up impulsively on the week, but it is occurring within a broader bearish impulse that previously drove the market lower. The fact that BTC matched the prior week’s upside distance and closed at the high of the candle signals sustained demand through the close, often seen during corrective squeezes and short-covering phases.
The break and close above the 3M level adds structural significance because it suggests the rebound is reclaiming prior horizontal control, forcing sellers to defend higher.
However, with trend labeled bearish PHASE 1, the key question is whether this push remains a corrective structure that stalls into overhead supply, or whether it develops into a deeper retracement that challenges the levels that initiated the bearish leg.
Key Levels and Scenarios
Bullish continuation (still corrective in the bigger picture) typically requires holding above the reclaimed 3M level and sustaining weekly closes near highs. Bearish continuation remains favored if price rejects at the noted prior-low resistances and rotates back below the reclaimed level, re-aligning with the dominant impulse.
- 3M level: reclaimed support zone that needs to hold to keep the corrective structure intact
- $78.430,00: prior low acting as first overhead resistance/supply
- $86.830,00: prior range lows where the bearish impulse initiated, key resistance for any deeper retracement
- Weekly candle high/close zone: immediate decision area for continuation vs rejection
Trading Implications
In this Bitcoin weekly analysis, risk skews toward volatility around resistance, as corrective rallies inside bearish trends can reverse sharply. Conservative positioning typically waits for confirmation at resistance (rejection) or a clean acceptance/hold above reclaimed support before anticipating continuation.
This analysis is for informational purposes only and does not constitute financial advice.