BTC Marketcap / Bitcoin
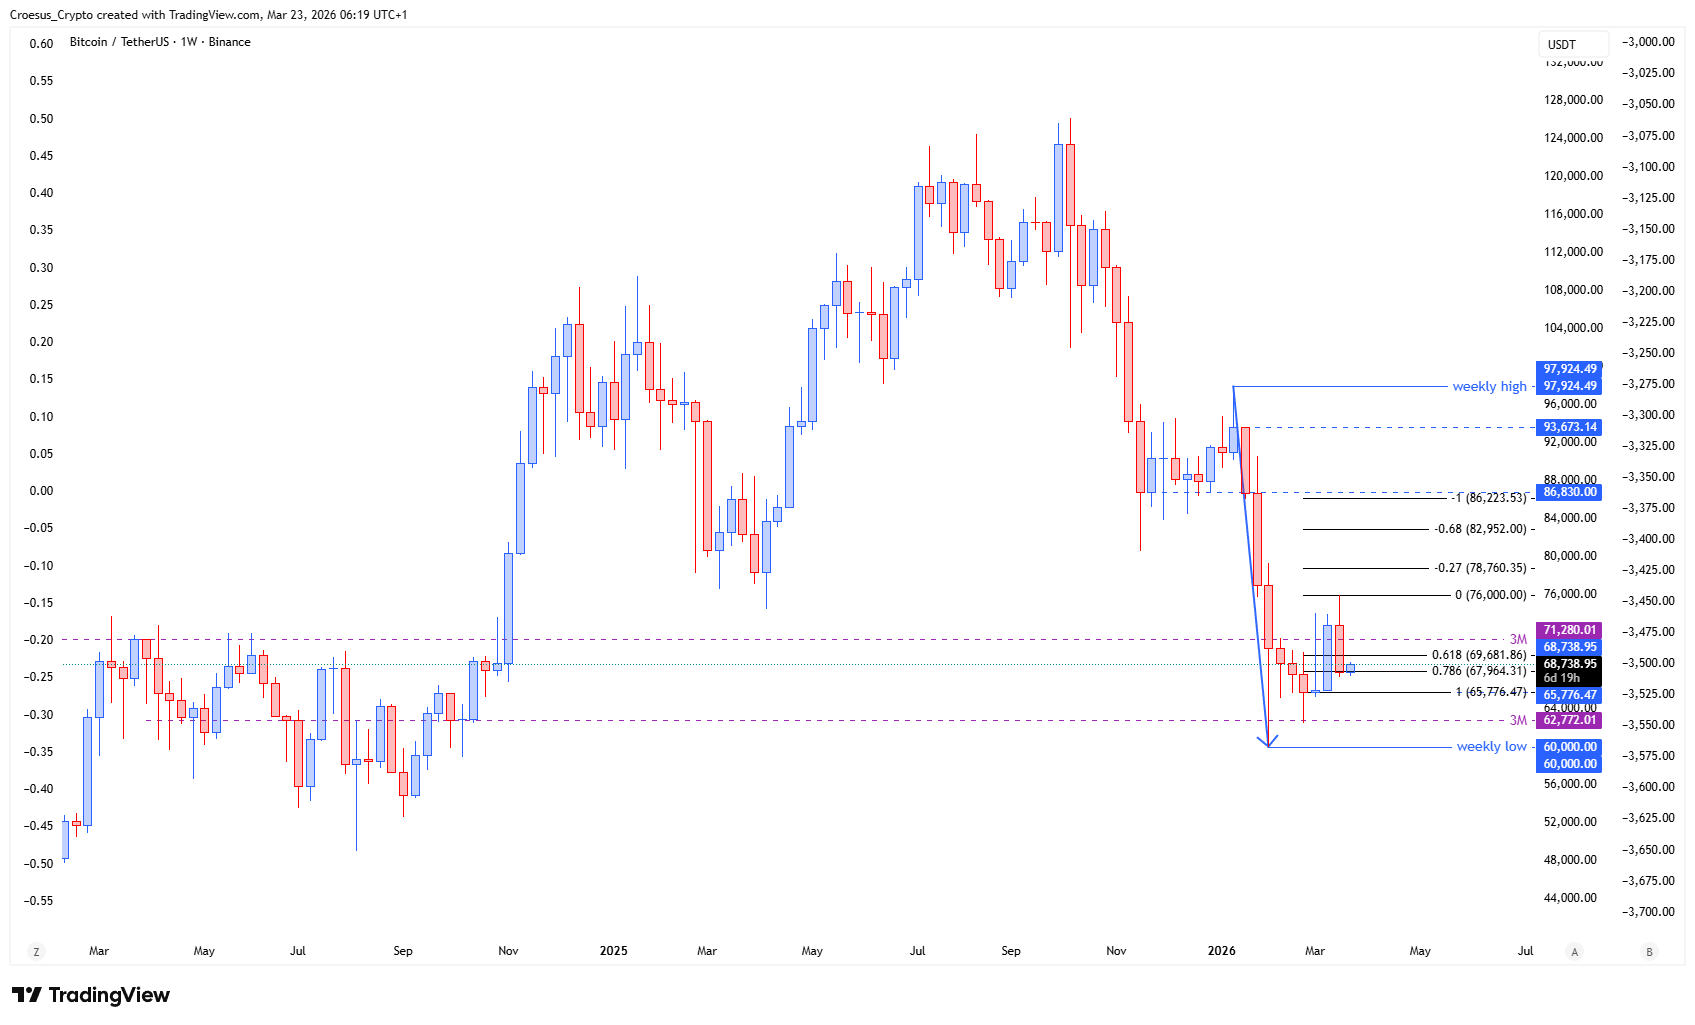
BTC weekly analysis week 12 March 2026. Bitcoin is currently in a bearish environment, with price attempting a corrective relief move after a larger bearish impulse, while reacting around a key Fibonacci retracement area.

- BTC shows us that the relief was stopped and pulled back towards the 0.786 retracement level.
- If price achieves to hold this level, we could see an expansion towards the -0.27,-0.68 or even the -1 expansion level.
- But treat this move still as a bullish corrective relief of a larger bearish impulse. It is and remains a tradeable move, but one where we need to remain cautious and take hard profits as soon as we reach the expansion levels.
Market Structure Analysis
Our BTC daily analysis shows a classic PHASE 1 corrective structure inside a broader bearish trend: the prior relief move failed to extend and price is now retracing back into the 0.786 Fibonacci level. Structurally, this is a key “decision zone” where buyers must defend to keep the corrective bounce intact. If price stabilises here, the market often shifts into an impulsive push higher within the correction, aiming for the noted Fibonacci expansion objectives. However, because the larger context remains bearish, this relief is best treated as a counter-trend leg until the market proves otherwise with clearer reclaim behaviour and support resistance acceptance above prior supply.
Key Levels and Scenarios
In this technical analysis, the bullish corrective scenario depends on holding the 0.786 retracement as support. Failure to hold that area keeps the dominant bearish impulse in control and increases the likelihood of continuation lower rather than expansion.
- 0.786 retracement level as the key support area for the corrective relief
- -0.27 expansion level as the first upside objective if the hold confirms
- -0.68 expansion level as a continuation objective within the corrective move
- -1 expansion level as an extended corrective target before larger-trend sellers may re-enter
Trading Implications
Given the bearish PHASE 1 backdrop, BTC daily analysis favours a cautious approach: the move can be tradeable, but it is still counter-trend, so risk control and disciplined profit-taking near the expansion levels remain central if price pushes higher.
This analysis is for informational purposes only and does not constitute financial advice.