BTC Marketcap / Bitcoin
BTC weekly analysis week 13 March 2026. Bitcoin is in a bearish corrective environment where recent upside progress has been fully retraced, keeping price action heavy and reactive around nearby support resistance.
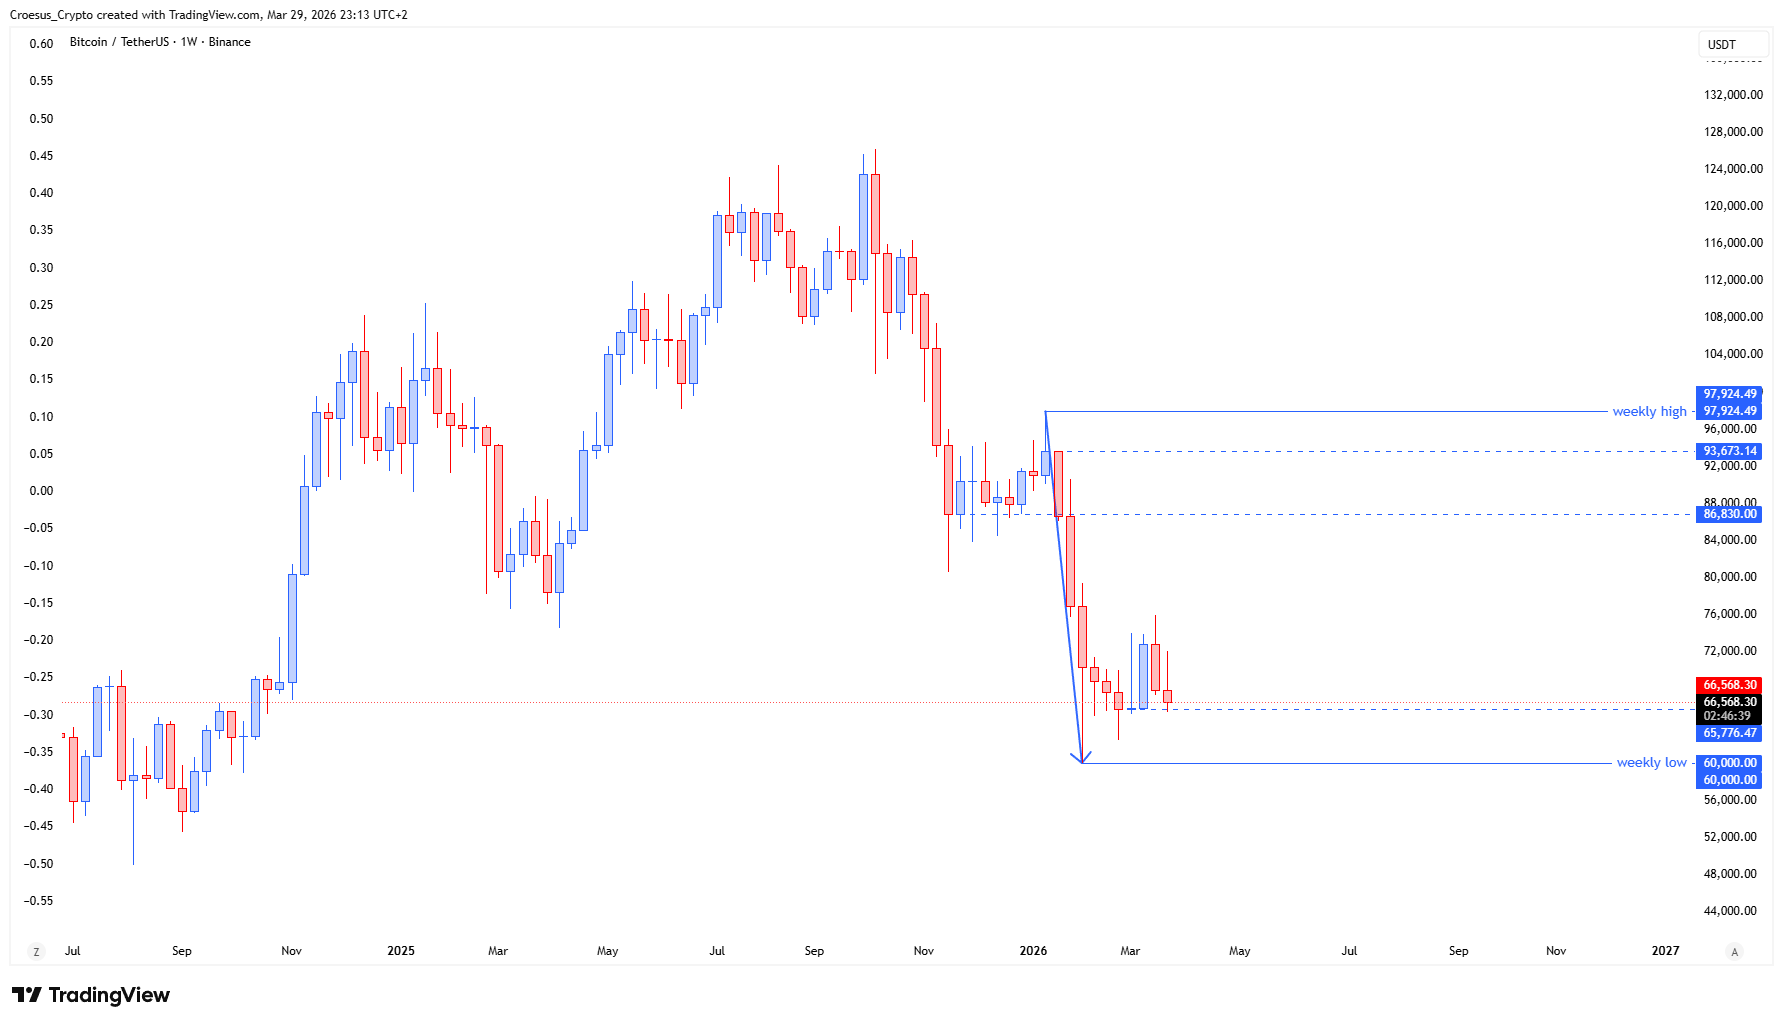
- BTC shows us that the last bullish candle is completely corrected.
- If we want to see the ABC correction play out, we need to see, on the lower timeframes, a clear reversal structure that indicates that bulls want to take power again
Market Structure Analysis
Our BTC weekly analysis highlights a key structural message: the market has fully corrected the prior bullish candle, which typically signals that the last impulse failed to hold and that sellers are still defending the area of prior breakdown.
In PHASE 1 conditions, we usually treat upside attempts as corrective until the market proves otherwise with a clear break of structure and a sustained hold above a reclaimed horizontal level. The mention of an “ABC correction” frames the current move as a corrective sequence rather than a fresh impulse; however, confirmation depends on what price does next at the nearest swing levels.
If lower timeframes start printing a recognizable reversal structure (followed by acceptance back above a reclaimed resistance), that would be the first structural evidence that bulls are regaining control and that the corrective leg may be completing rather than extending.

Key Levels and Scenarios
In this BTC daily analysis, the bearish scenario remains favored while price continues to reject from prior supply and fails to reclaim broken structure. A bullish recovery case requires a visible reversal structure on lower timeframes, followed by a break of structure and clean acceptance above the most recent resistance (turning it into support).
- Most recent swing low: key support that defines whether the correction is extending
- Most recent swing high / breakdown area: key resistance to reclaim for any bullish continuation attempt
- Prior broken structure zone: acceptance above it would signal corrective exhaustion and trend stabilization
This analysis is for informational purposes only and does not constitute financial advice.