

BTC Marketcap / Bitcoin
BTC weekly analysis Week 14 2026. Bitcoin is still trading in a bearish corrective context, but recent candlestick behaviour suggests the market is attempting to build a base after the latest sell-side push.
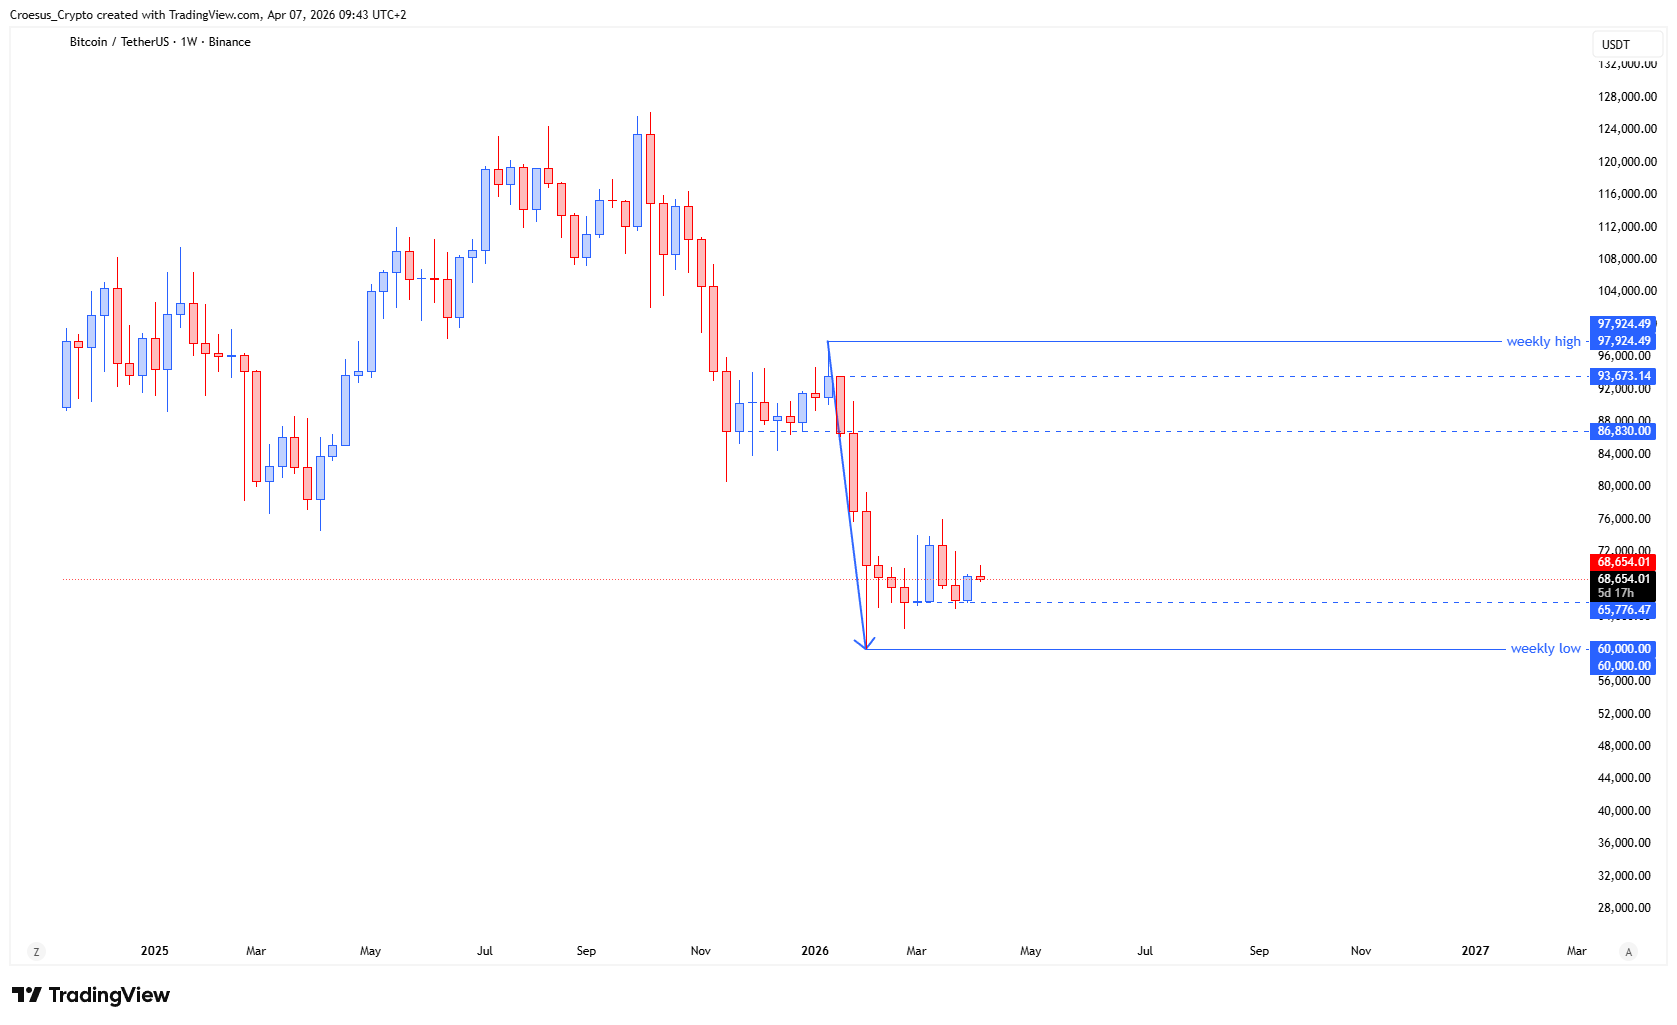
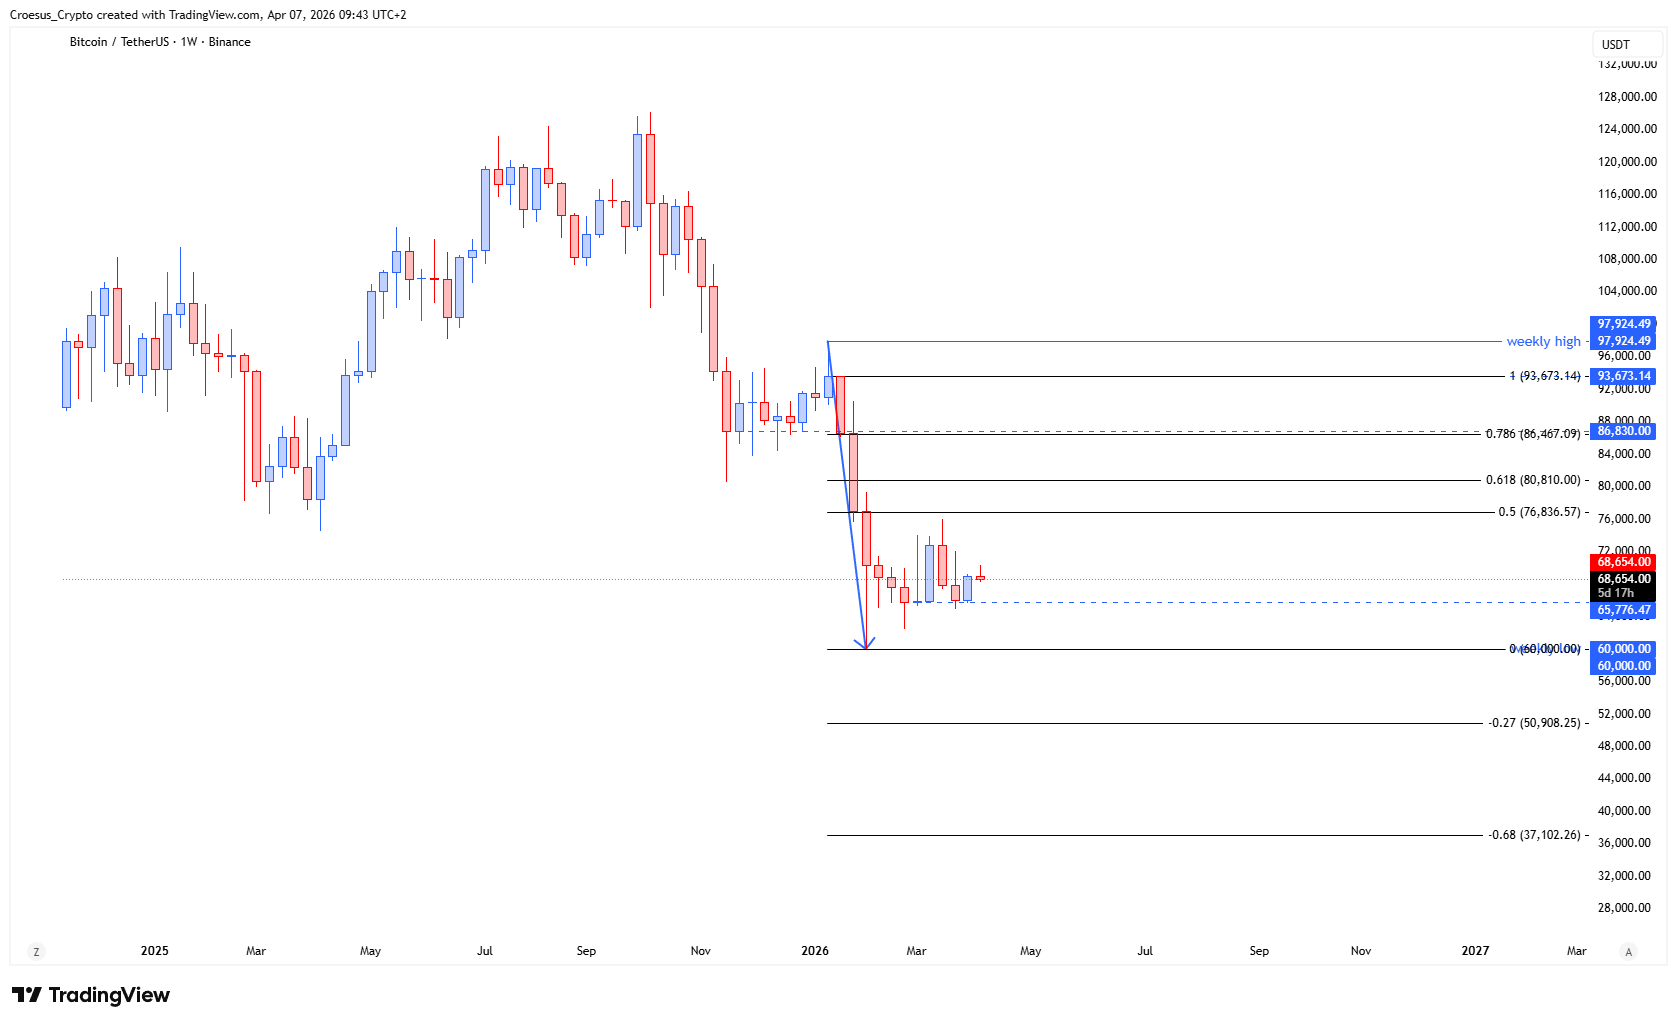
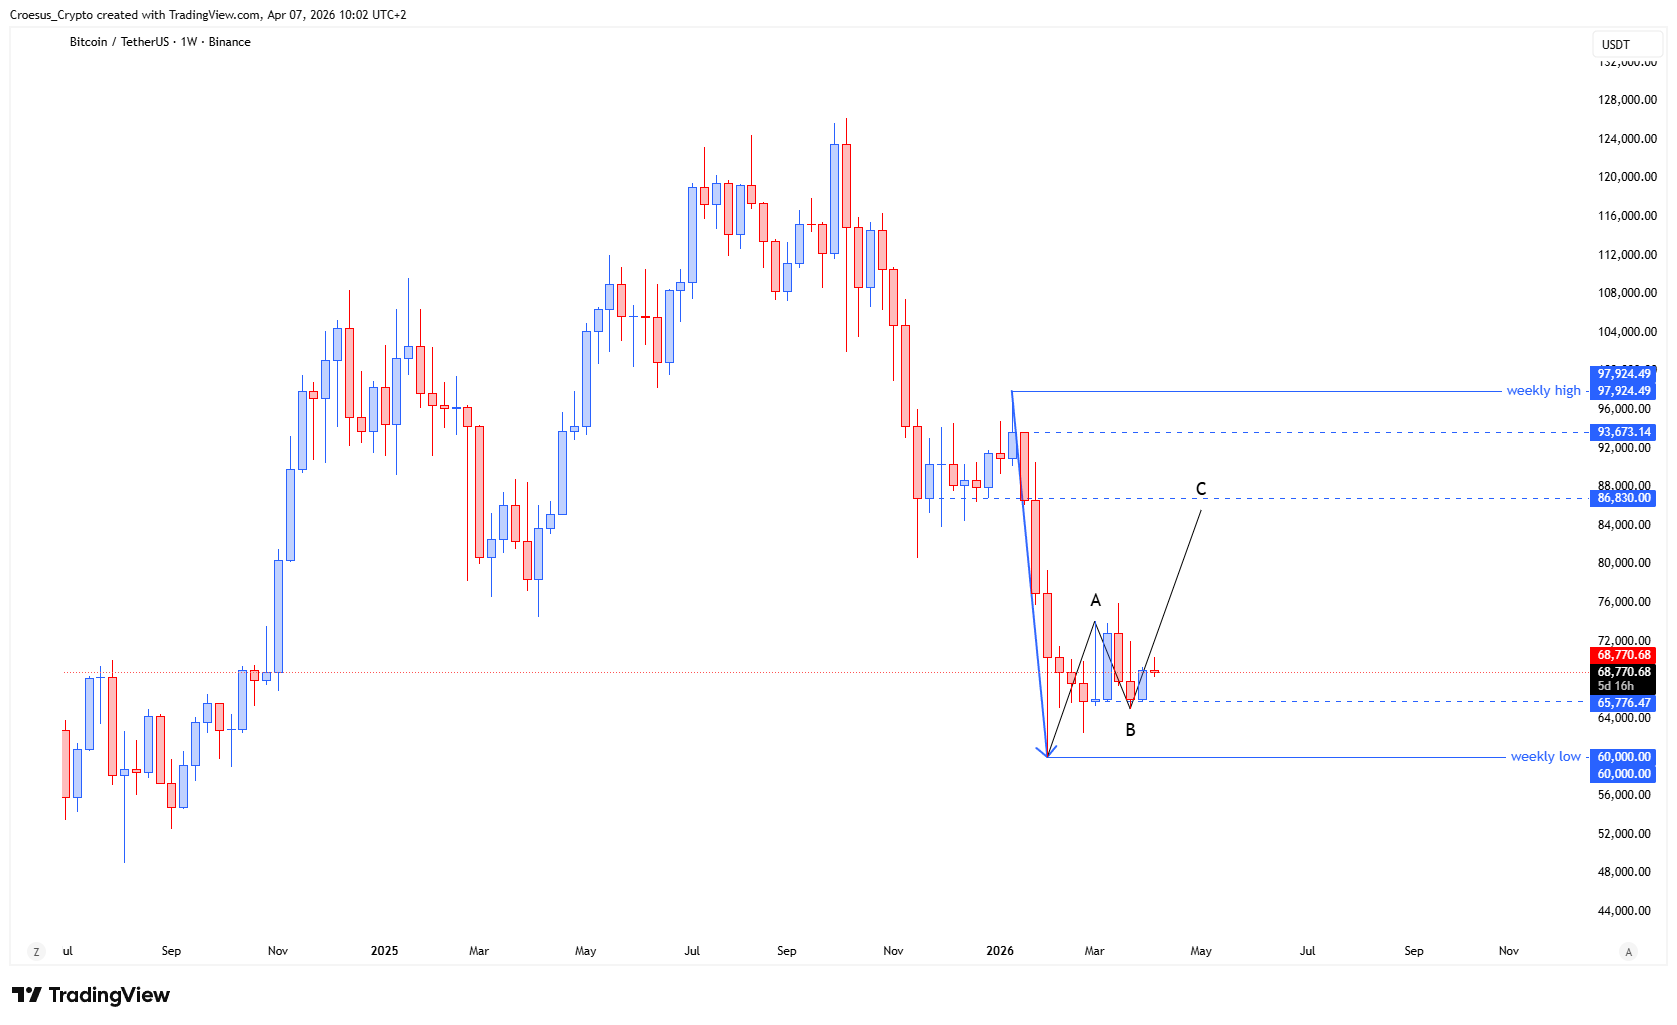
- BTC shows us that last week's candle printed a bullish engulfing candle, possibly confirming a double bottom. This could be the start of our larger ABC correction.
- This week we could see a bearish retest before possibly going higher.
Market Structure Analysis
From a naked trading perspective, our BTC weekly analysis centres on whether price is transitioning from an impulsive sell-off into a corrective structure. A bullish engulfing candle at the lows often signals a shift in order flow, especially when it forms at a prior swing low and aligns with a potential double bottom.
Structurally, that suggests sell-side liquidity has been absorbed and the market is attempting to defend the range low.
With trend still labelled bearish and PHASE 1 marked as corrective, we treat the current recovery as a counter-trend move until proven otherwise. The “bearish retest” scenario fits typical corrective behaviour: price often revisits the breakout/reaction zone (old support-resistance) to confirm whether buyers can hold it. If that retest holds and we see follow-through, it supports the idea of an emerging ABC correction rather than immediate continuation lower.
Key Levels and Scenarios
In this BTC weekly analysis, the key question is whether bulls can defend the recent base and convert the retest area into support resistance acceptance. Failure to hold the base keeps the bearish structure intact and re-opens downside continuation risk.
- The double bottom low area as the primary structural support and invalidation zone
- The bullish engulfing candle low as the immediate reference for downside failure
- The current retest zone as the decision area for acceptance vs rejection
- The prior swing high above as the first meaningful resistance in a corrective bounce
This analysis is for informational purposes only and does not constitute financial advice.