

BTC Marketcap / Bitcoin
BTC weekly analysis Week 15 2026. Bitcoin is trading in a bearish corrective context, with buyers showing a brief reaction last week but still failing to reclaim the key weekly resistance, keeping the market biased toward a liquidity sweep lower inside the current range.
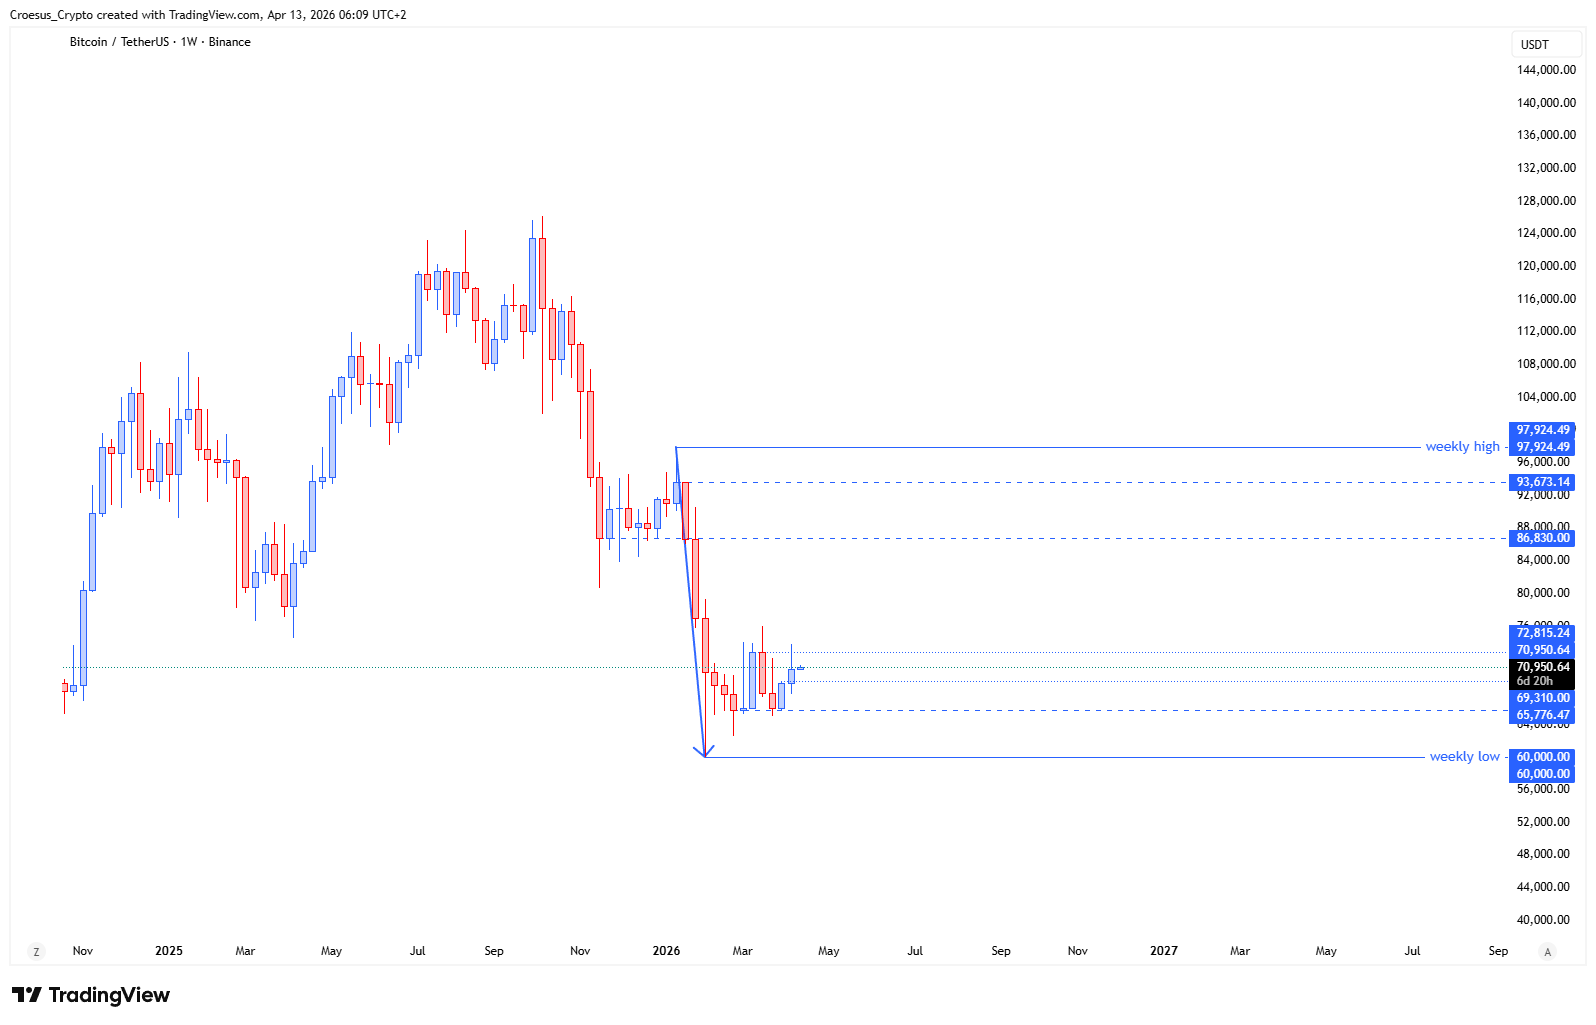
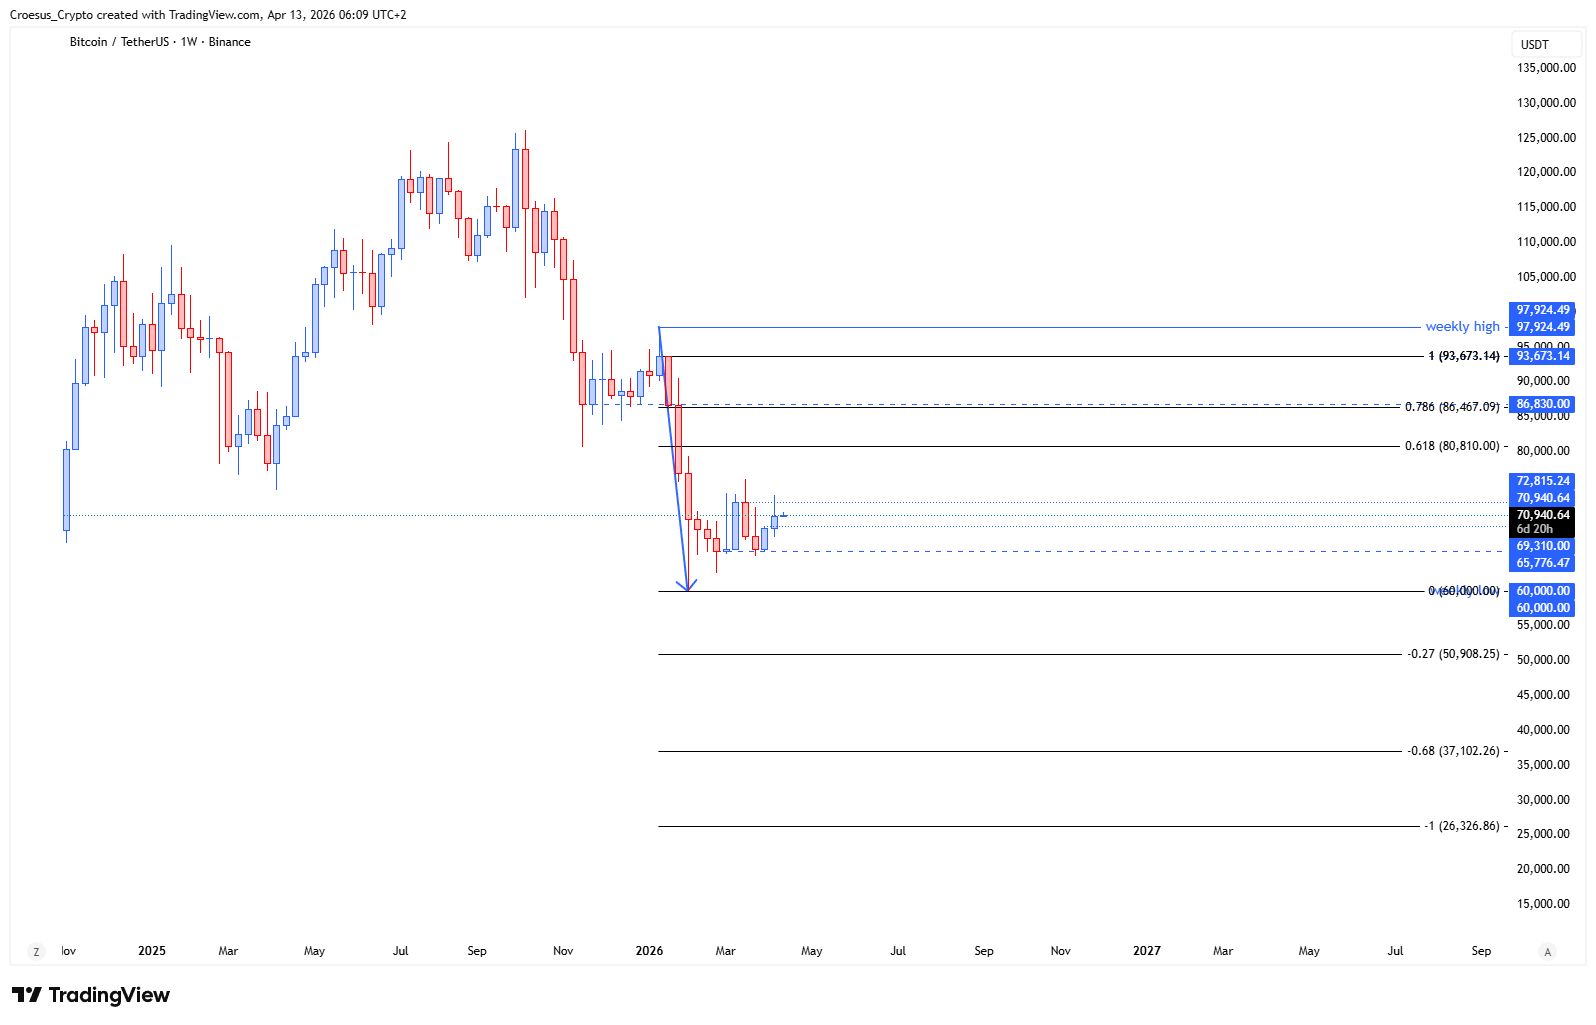
- BTC shows us that last week's candle printed a bullish candle but failed to close above the weekly level and was rejected there.
- If we continue to fail pushing higher, we will need to get liquidity lower within the local weekly range between 65.776 $ and 72.815 $.
- Nevertheless, the ABC-correction remains intact at this moment, it just needs some more conviction to push towards the C-level.
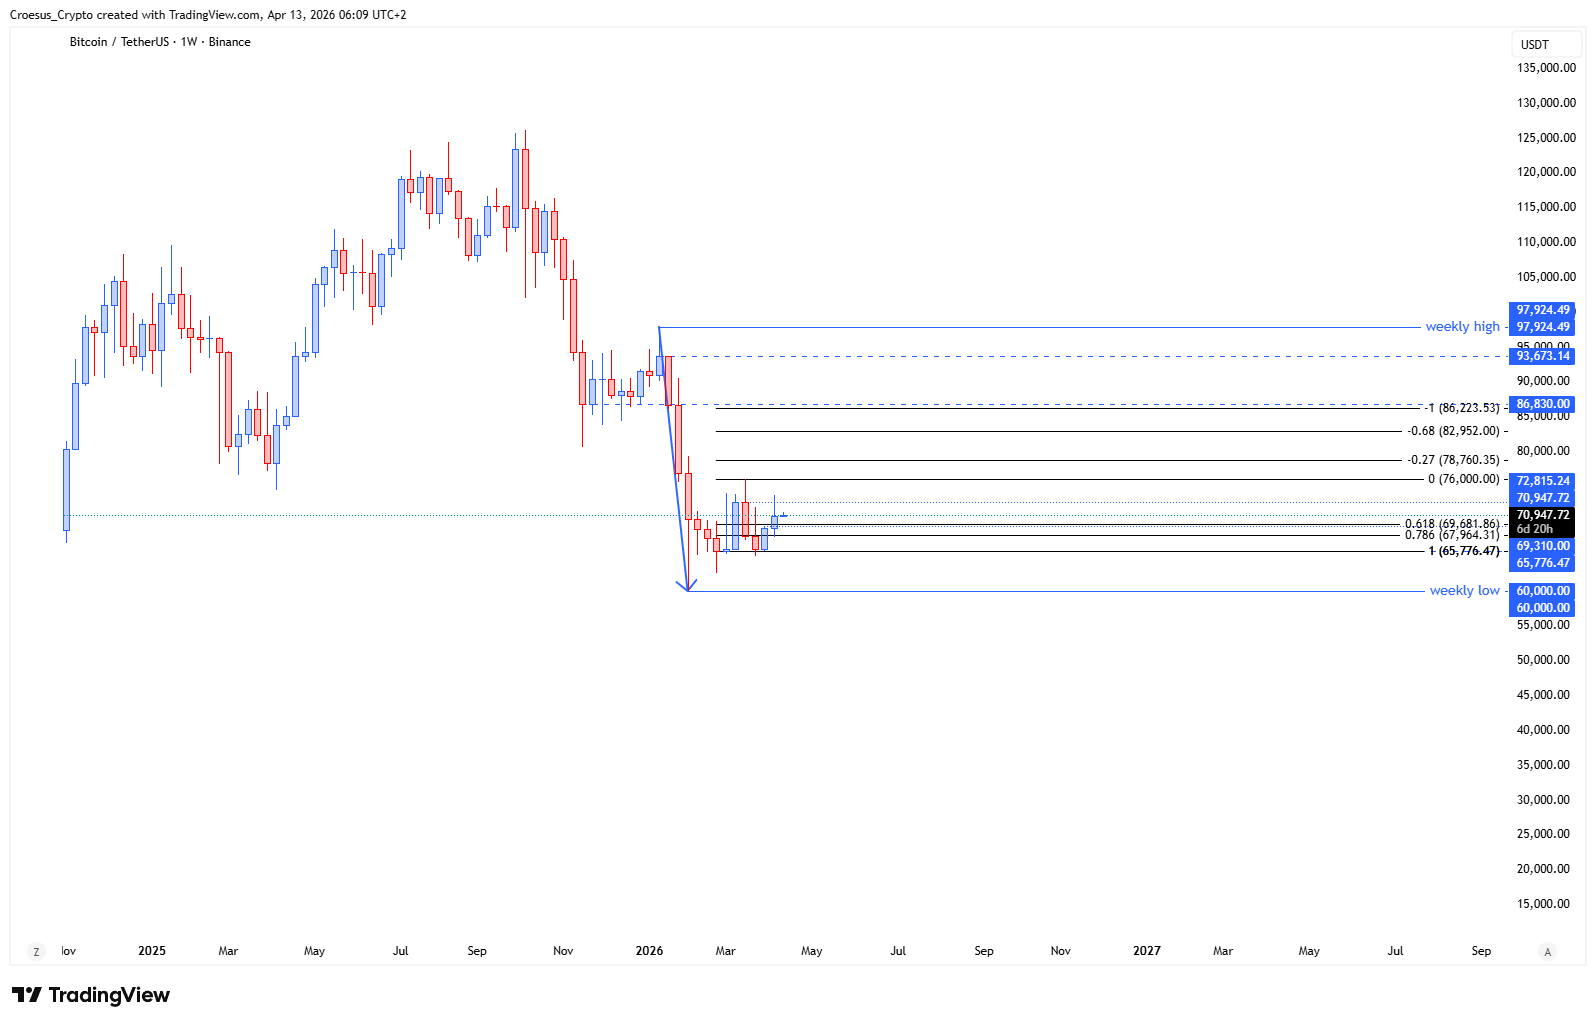
Market Structure Analysis
From a naked trading perspective, the main takeaway in our BTC weekly analysis is the rejection at the weekly level after a bullish weekly candle.
Structurally, that behaviour often signals unresolved overhead supply: price attempted to rotate higher, but the weekly close failed to confirm acceptance above resistance, which keeps the move classified as corrective rather than impulsive. With price still trading inside the local weekly range, the next logical path is a sweep of resting liquidity toward the range low before any sustainable reversal attempt. The mention of an intact ABC-correction reinforces that this is still a structured pullback phase (PHASE 1), where the market typically seeks completion at the C-leg before a clearer directional impulse can develop.
Key Levels and Scenarios
Bearish continuation remains favoured while BTC fails to reclaim the weekly level on a closing basis. A continuation scenario focuses on a rotation lower through the range to collect liquidity and progress the correction toward the C-level. A bullish invalidation would require acceptance back above the weekly level and a strong hold above the range high, shifting the structure away from a simple corrective sequence.
- 72.815 $: local weekly range high; key area to reclaim for bullish acceptance
- Weekly level: current resistance; last week’s close failed above it and rejected
- 65.776 $: local weekly range low; primary liquidity zone to watch for a sweep
- C-level: structural objective for completion of the ABC-correction
Trading Implications
In this BTC weekly analysis, risk remains elevated inside the range because both sides can be targeted for liquidity. Conservative positioning typically waits for either a clean sweep and reaction from the range low, or a confirmed reclaim of the weekly level to reduce the odds of being caught in a corrective shakeout.
This analysis is for informational purposes only and does not constitute financial advice.