BTC Marketcap / Bitcoin
BTC weekly analysis Week 16 2026. Bitcoin remains in a bearish environment where the current price action reads as a corrective bounce into resistance, keeping the broader downside risk active while the market reacts around a key Fibonacci area.

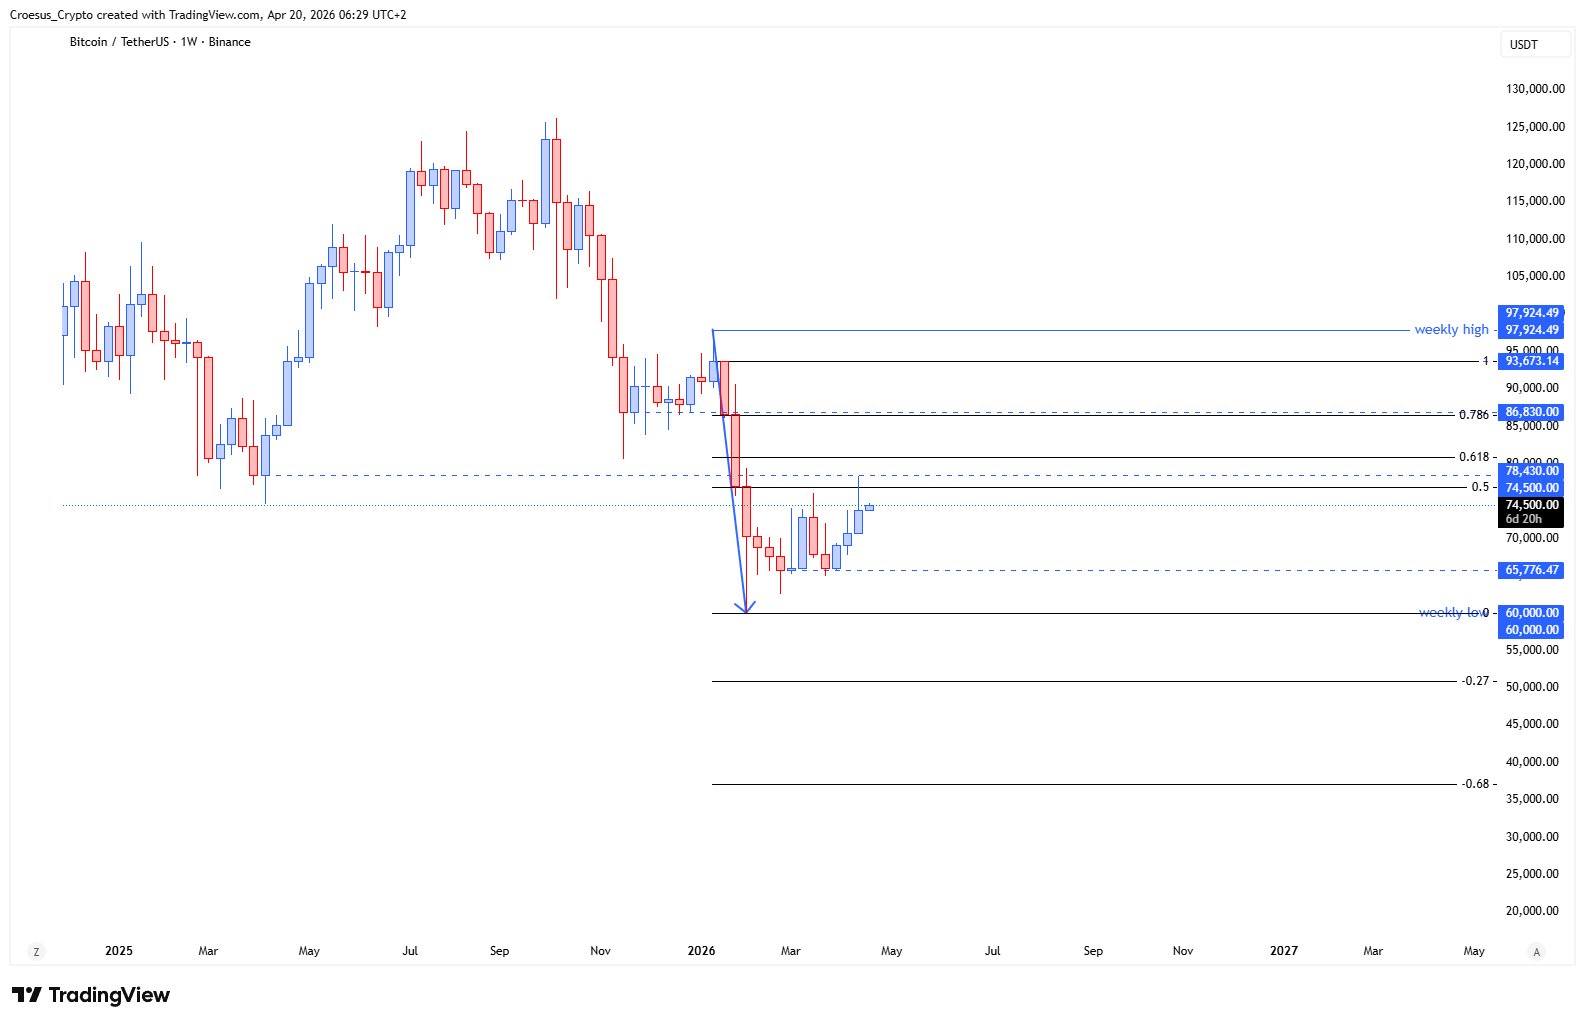
- BTC shows us that last week's candle printed a bullish candle but got rejected at the 0.5 Fib retracement level.
- We are still in a corrective move of a bearish impulse, which means that, after a bullish correction, we can still see a bearish continuation.
- Take into account that, with the prior bearish impulse down, price also corrected towards the 0.5 level before seeing bearish continuation.
Market Structure Analysis
Our BTC weekly analysis continues to frame the move as a corrective structure within a broader bearish impulse.
Structurally, the rejection at the 0.5 Fibonacci retracement suggests sellers are still defending a key midpoint of the prior leg down, which often acts as a decision zone in naked trading. The fact that the latest weekly candle is bullish but fails to accept above that 0.5 area supports the idea of a corrective rally meeting supply rather than starting a clean new impulse. With the market previously correcting back into the same 0.5 zone before rolling over, this becomes a notable “repeat behavior” area: if price remains capped here, the path of least resistance stays aligned with continuation back toward prior lows.
Key Levels and Scenarios
Bearish continuation remains the primary scenario in this BTC weekly analysis as long as the corrective leg fails to reclaim and hold above the 0.5 Fibonacci retracement. A stronger bearish continuation signal would be a clear shift back to impulsive selling after this rejection, confirming that the correction is complete. Any sustained acceptance above the 0.5 area would weaken the immediate bearish thesis and suggests the correction is extending.
- 0.5 Fib retracement level as the key resistance zone driving the current rejection
- The corrective swing high area as a trigger zone for continuation vs extension of the correction
- The bearish impulse low as the primary structural downside reference if continuation unfolds
This analysis is for informational purposes only and does not constitute financial advice.