BTC Marketcap / Bitcoin
BTC Weekly Analysis Week 17 2026. Our BTC weekly analysis shows price pressing into a key inflection area after a marginal weekly close above prior resistance, while broader conditions still read as bearish and corrective.
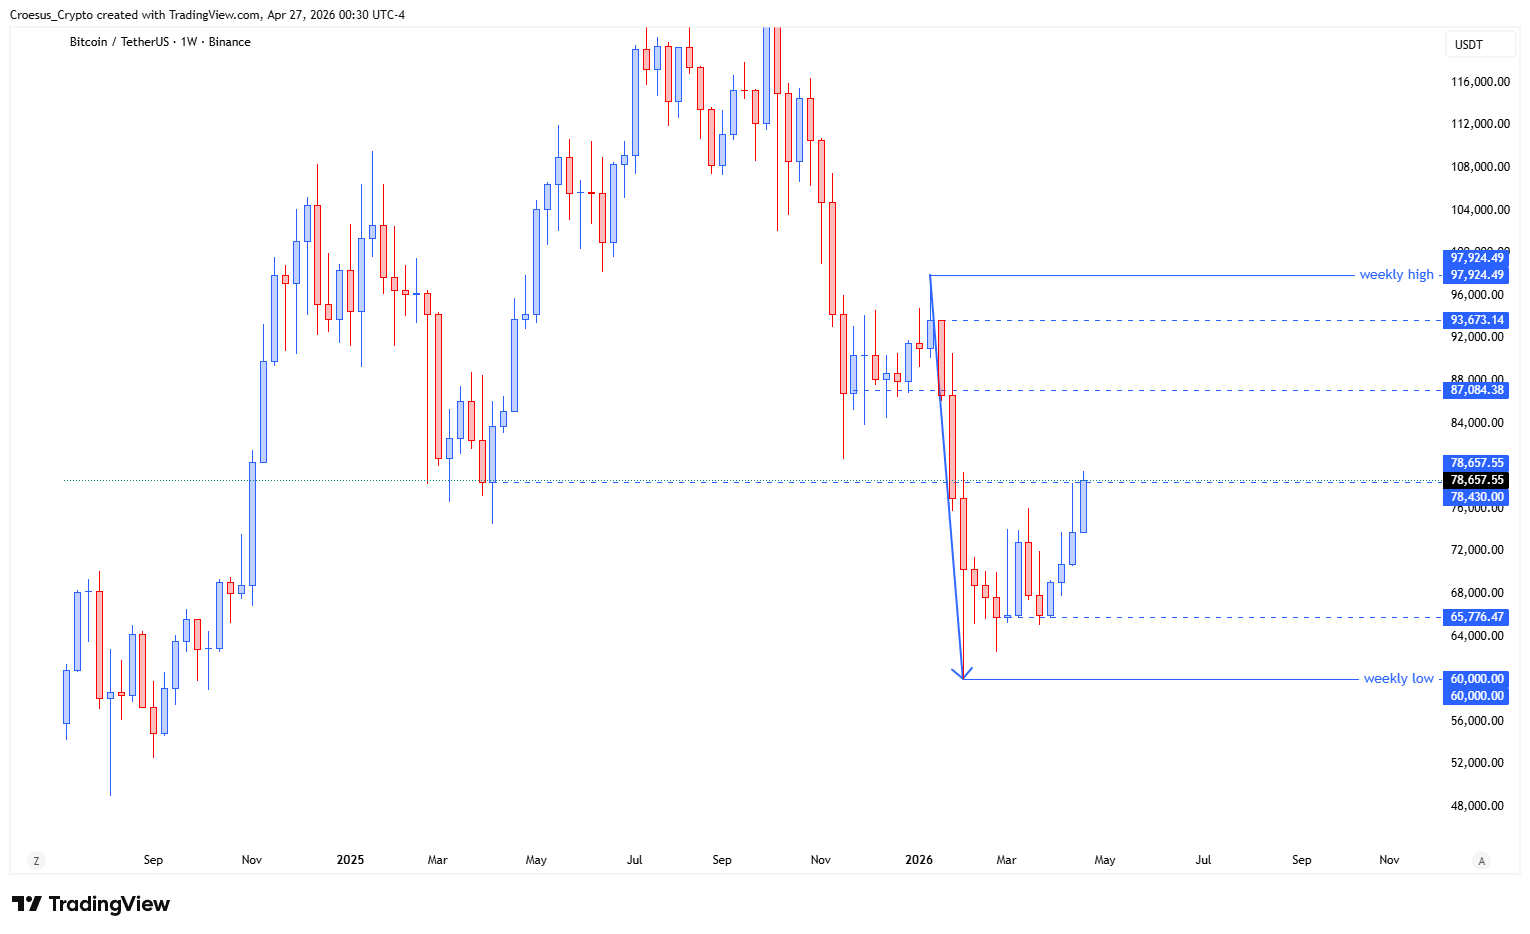

- BTC shows us that the price pushed higher this week and closed slightly above the resistance.
- If we take the fibonacci retracement of the first leg up, we can see that we touched the -0.27 level (take profit), meaning that we might expect a retracement. We can only pull a fib retracement when we see our first bearish candle so we have to wait until that moment in order to know our target. A second possibility is that the price has enough liquidity (power) to push through higher until the fib -0.68.
Market Structure Analysis
Structurally, this BTC weekly analysis sits in a corrective (PHASE 1) environment, where upside pushes can still function as counter-trend rallies until the market proves otherwise. The weekly close slightly above resistance signals a short-term break attempt, but the context remains fragile because acceptance above resistance still needs follow-through. With the first leg up established, the Fibonacci retracement framework becomes relevant for mapping where a corrective pullback could develop once a bearish weekly candle prints. The touch of the -0.27 (take profit) area often aligns with a zone where momentum can cool, so a retracement scenario is a reasonable expectation unless buyers show continued strength and liquidity to extend toward the -0.68 level.
Key Levels and Scenarios
Bullish continuation requires sustained acceptance above the former resistance and continued strength beyond the -0.27 reaction area. Bearish continuation remains valid if the market fails to hold above resistance and confirms a reversal with a bearish weekly candle, at which point the Fibonacci retracement can be used more cleanly to frame downside objectives.
- Prior resistance (now the key decision level for support resistance)
- Fibonacci -0.27 level (take profit zone and potential retracement trigger)
- Fibonacci -0.68 level (extension target if liquidity supports continuation)
- First bearish weekly candle (confirmation trigger to anchor the retracement target)
Trading Implications
In a bearish PHASE 1 backdrop, our technical analysis favors patience: aggressive traders typically wait for rejection/confirmation signals, while conservative traders look for acceptance above resistance before treating the move as anything more than a corrective push. Risk is highest while price hovers around the broken level, where failed breaks and quick reversals are common.
This analysis is for informational purposes only and does not constitute financial advice.