

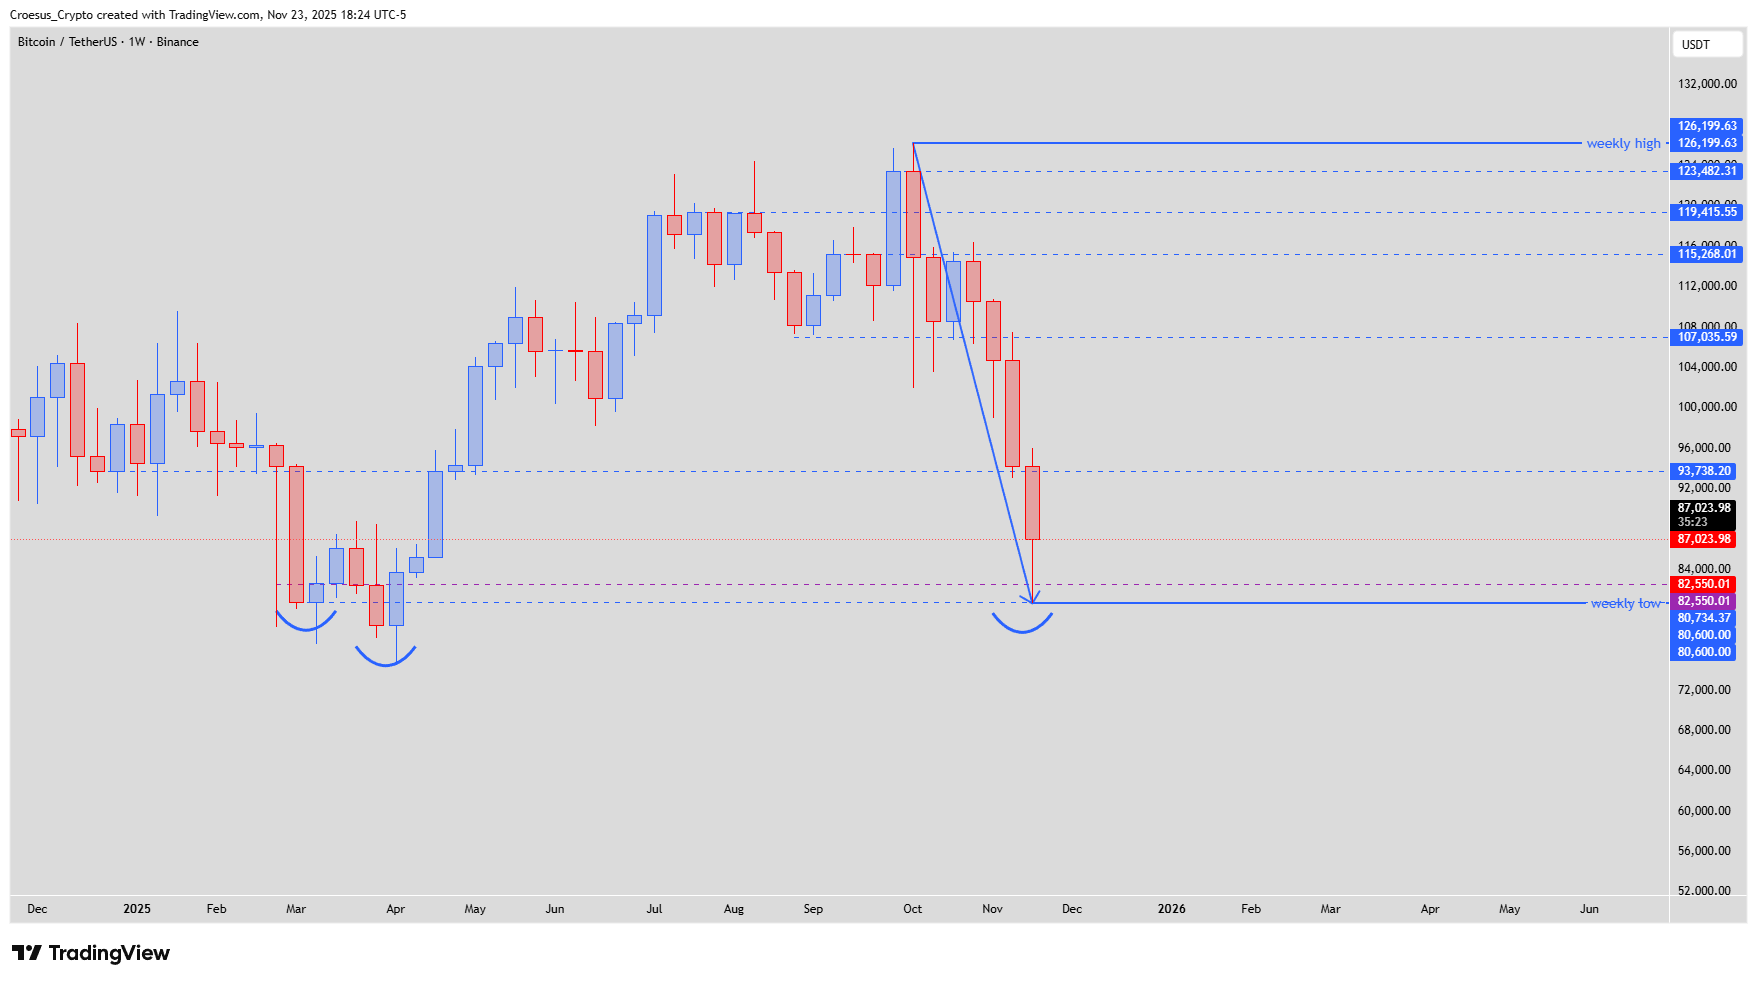
In this BTC weekly analysis for Week 47 of November 2025, we see Bitcoin extend its Phase 4 prolonged bearish impulse after failing to hold prior support. Price finally reached a stacked 3M, Monthly and Weekly key level, where the current swing low is set at 80,600.00 $, making this a critical area for potential reaction in our technical analysis.
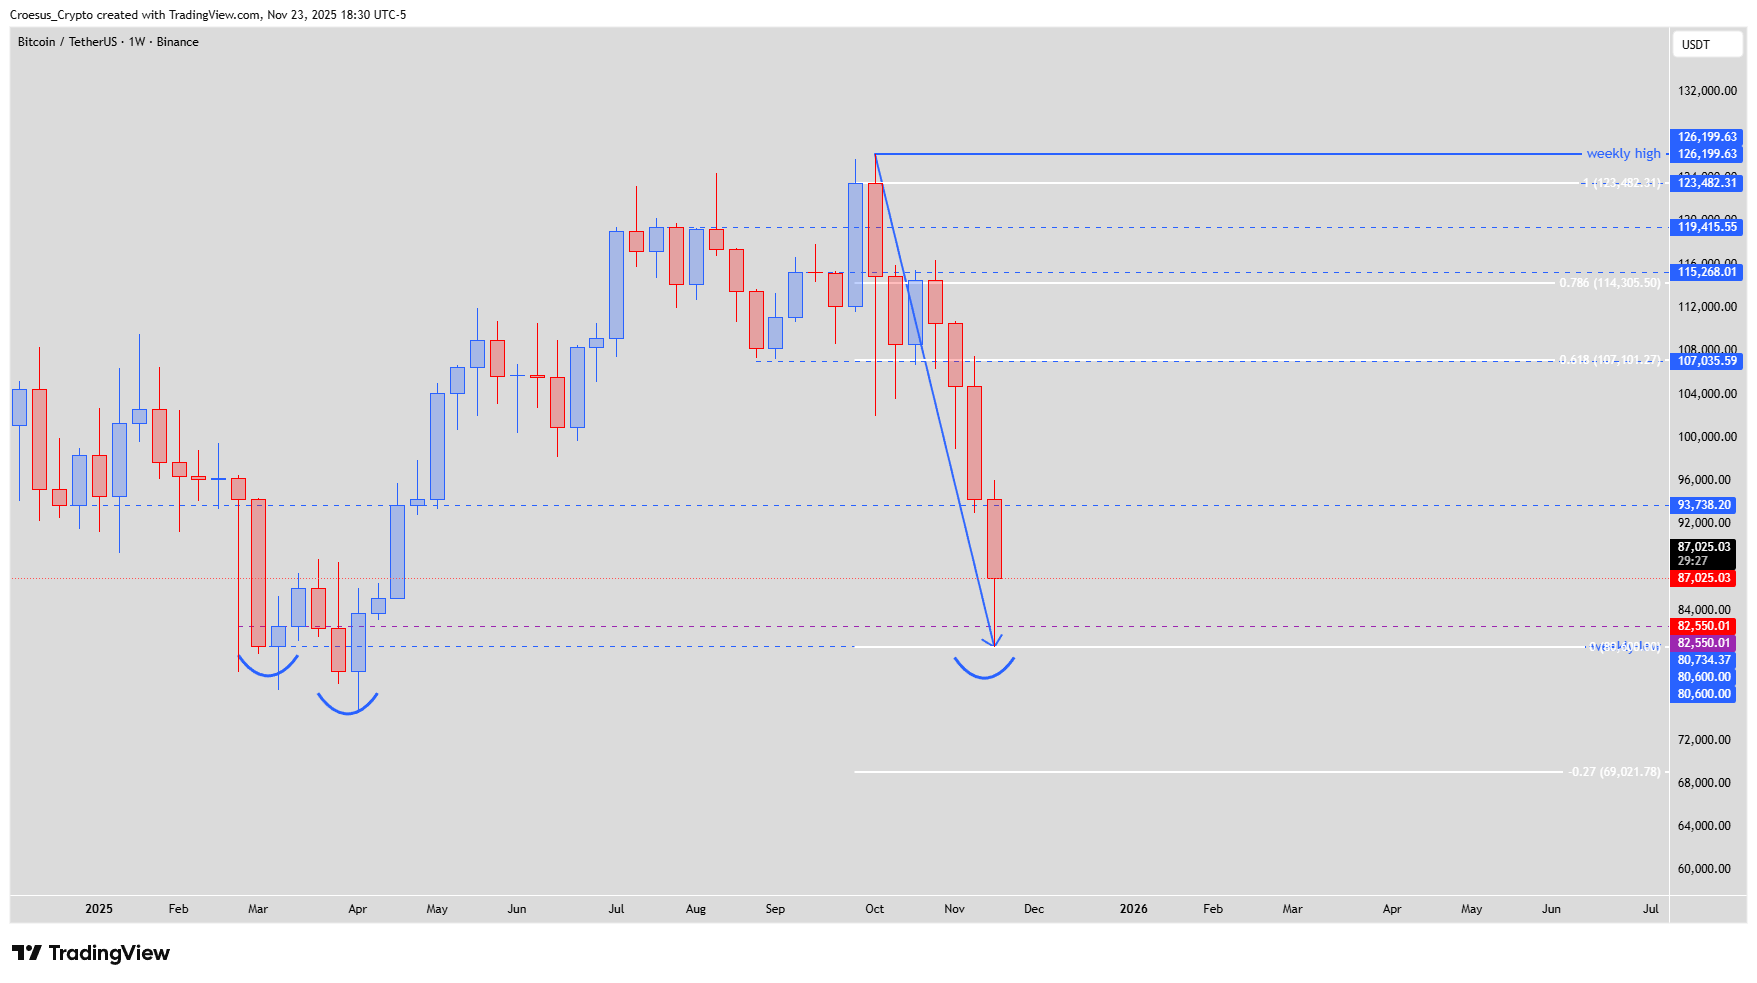
BTC weekly chart – Week 47 2025 with prolonged bearish impulse breaking 93,738.20 $ and tagging confluent 3M, Monthly and Weekly support around 80,600 $
Technical Analysis Key Points
- Price failed to keep the 93,738.20 $ level which we indicated last week as a potential support
- Price continued further down and hit a confluent 3M, M and W key level.
- The low of this swing low is set on the level 80,600.00 $.
- Hitting a confluent level on different higher timeframes often indicates a point of reversal.
- Note that any reversal still needs to treated as a correction of a very impulsive bearish leg down. Don't get trapped during the leg-up. Manage your risk and take partial take profits @ key levels as 107,000 $, 115,000 $, 119,000 $. At any of these point a potential bearish continuation could start.
Market Structure Analysis
This BTC weekly analysis confirms a clean break of support resistance at 93,738.20 $, followed by a sharp continuation into higher-timeframe demand. The confluent 3M/M/W level around 80,600.00 $ marks the current exhaustion point of the impulse and is now the key structural line in the sand. Historically, such multi-timeframe confluence often attracts countertrend flows, even when no explicit Fibonacci levels are driving the move, and can fuel a corrective rally before any new leg lower.
As long as price trades below the prior breakdown zone and we keep making lower highs, the dominant structure remains bearish; any bounce from here is, by definition, corrective.
Key Levels and Scenarios
Bullish scenario: a relief rally from around 80,600.00 $ could target successive resistance zones at 107,000 $, 115,000 $ and 119,000 $, where we expect strong supply and potential bearish continuation.
Key levels to watch:
80,600.00 $ – confluent 3M/M/W key support and swing low
3,738.20 $ – broken support; may act as resistance on first retest
107,000 $ – first corrective target and key support resistance pivot
115,000 $ – deeper corrective target where sellers may reload
119,000 $ – upper resistance zone and potential cap of the relief move
Trading Implications
Within this Phase 4 prolonged impulse, long setups are countertrend and should focus on tactical entries near the confluent support with tight invalidation below 80,600.00 $, scaling out into 107,000 $, 115,000 $ and 119,000 $ while remaining prepared for renewed bearish momentum at any of these resistance layers.
This analysis is not financial advice; always do your own research and manage your risk before trading.