

BTC Marketcap / Bitcoin
BTC weekly analysis week 5 January 2026. Bitcoin is trading in a bearish continuation context on the weekly timeframe, with price pressing below prior support and forcing the market to decide whether the recent breakdown is accepted or rejected.
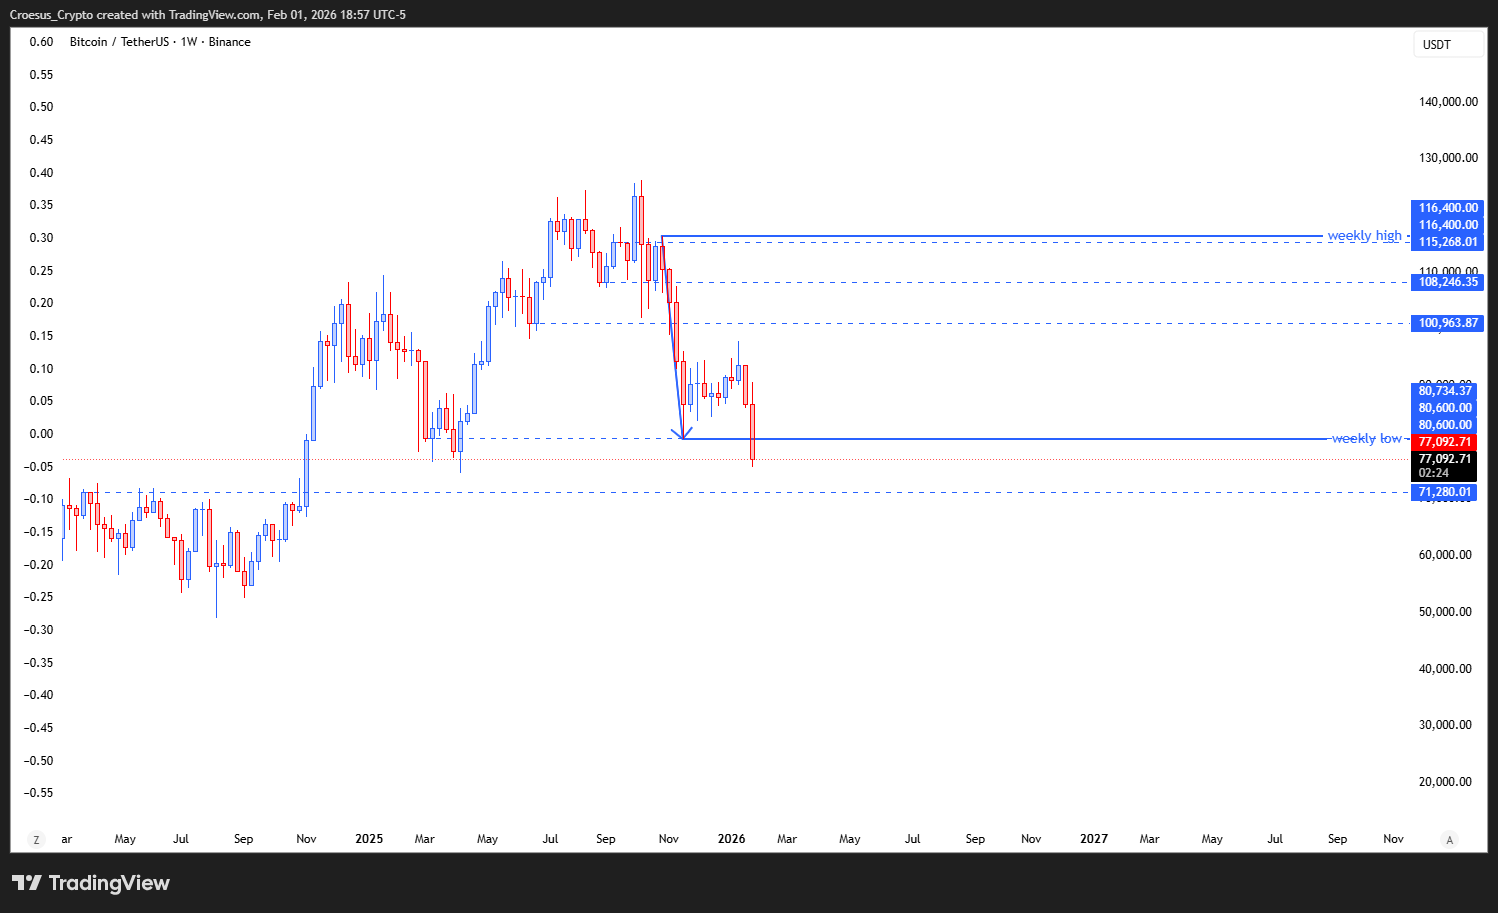
- Same as with the TOTAL chart : a bearish continuation breaking the weekly low
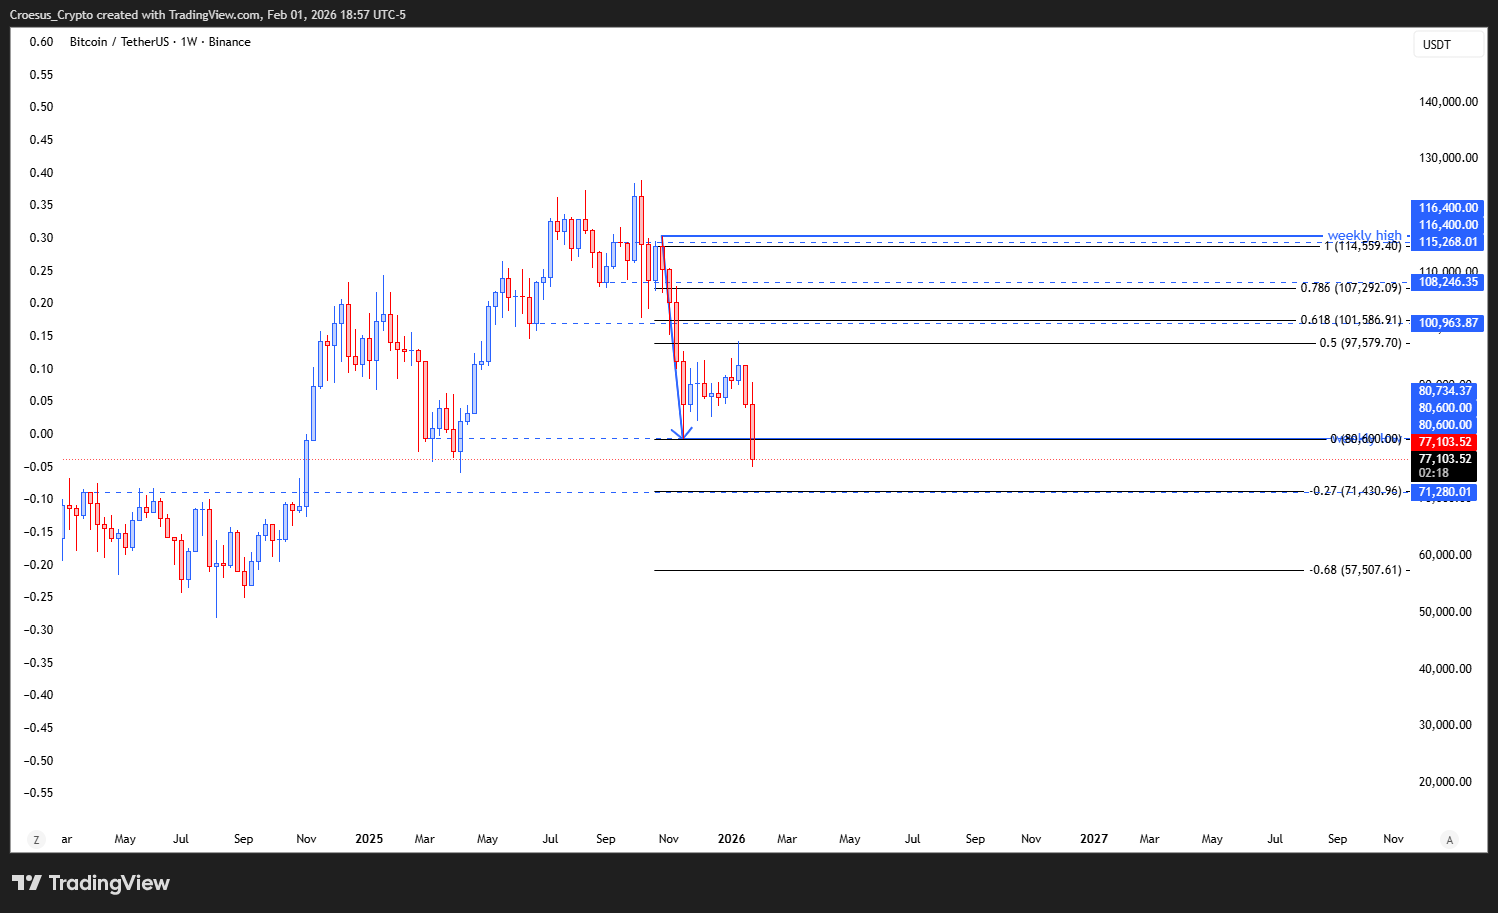
- The price only retraced towards the 0.5 level (equilibrium) but did not tap the golden pocket
- The first target is the -0.27 level, coinciding with the prior highs. But once this level is touched, we expect a major retracement towards the golden pocket completing the corrective move of the bearish impulse.
Market Structure Analysis
In our BTC weekly analysis, the active leg reads as a bearish impulse that has already pushed through the weekly low, keeping market structure heavy. The limited retracement toward the 0.5 “equilibrium” level (without tagging the 0.618) suggests sellers are maintaining control and buyers are not yet forcing a deeper mean-reversion move. Structurally, the focus shifts to how price behaves around the prior range low area: a sharp reclaim back above broken support would signal a potential liquidity grab and failed breakdown, while continued acceptance below prior lows keeps the bearish continuation intact. The -0.27 level is framed as the first structural objective, and the mention of a “major retracement towards the golden pocket” implies that any touch of that target may be followed by a corrective rotation back into resistance rather than immediate continuation.
Key Levels and Scenarios
For this BTC weekly analysis, the bearish scenario remains valid as long as price holds below the broken weekly low and continues to accept under former support resistance. A constructive alternative requires a clean reclaim of the range-low zone, turning the breakdown into a failed move and forcing a corrective rebuild before any downside continuation.
- Range lows - key support area currently being retested aggressively
- 0.5 level (equilibrium) - key retracement reference; failing here keeps downside pressure
- -0.27 level - first target zone, aligning with prior highs per the draft
- Golden pocket - expected major retracement zone after the -0.27 target is reached
- 80.600,00 USDT - invalidation on a close below this level
- “Fake out zone” - potential sweep area if support fails before any recovery
Trading Implications
With price compressing around major support resistance, execution risk is elevated and the next weekly close carries more weight than intrawick volatility. Aggressive participation typically looks for evidence of a defended low and a reclaim back into the range, while conservative approaches often wait for structure to re-establish (higher low / reclaim) before treating any bounce as more than a corrective move within a bearish impulse.
This analysis is for informational purposes only and does not constitute financial advice.