

In this BTC weekly analysis for week 50 of 2025, we focus on the reaction at weekly supply after the sharp bearish impulsive sell-off. Our technical analysis suggests that the latest rejection at resistance keeps the market in a corrective phase, with liquidity likely to be searched lower toward demand before any larger recovery leg.
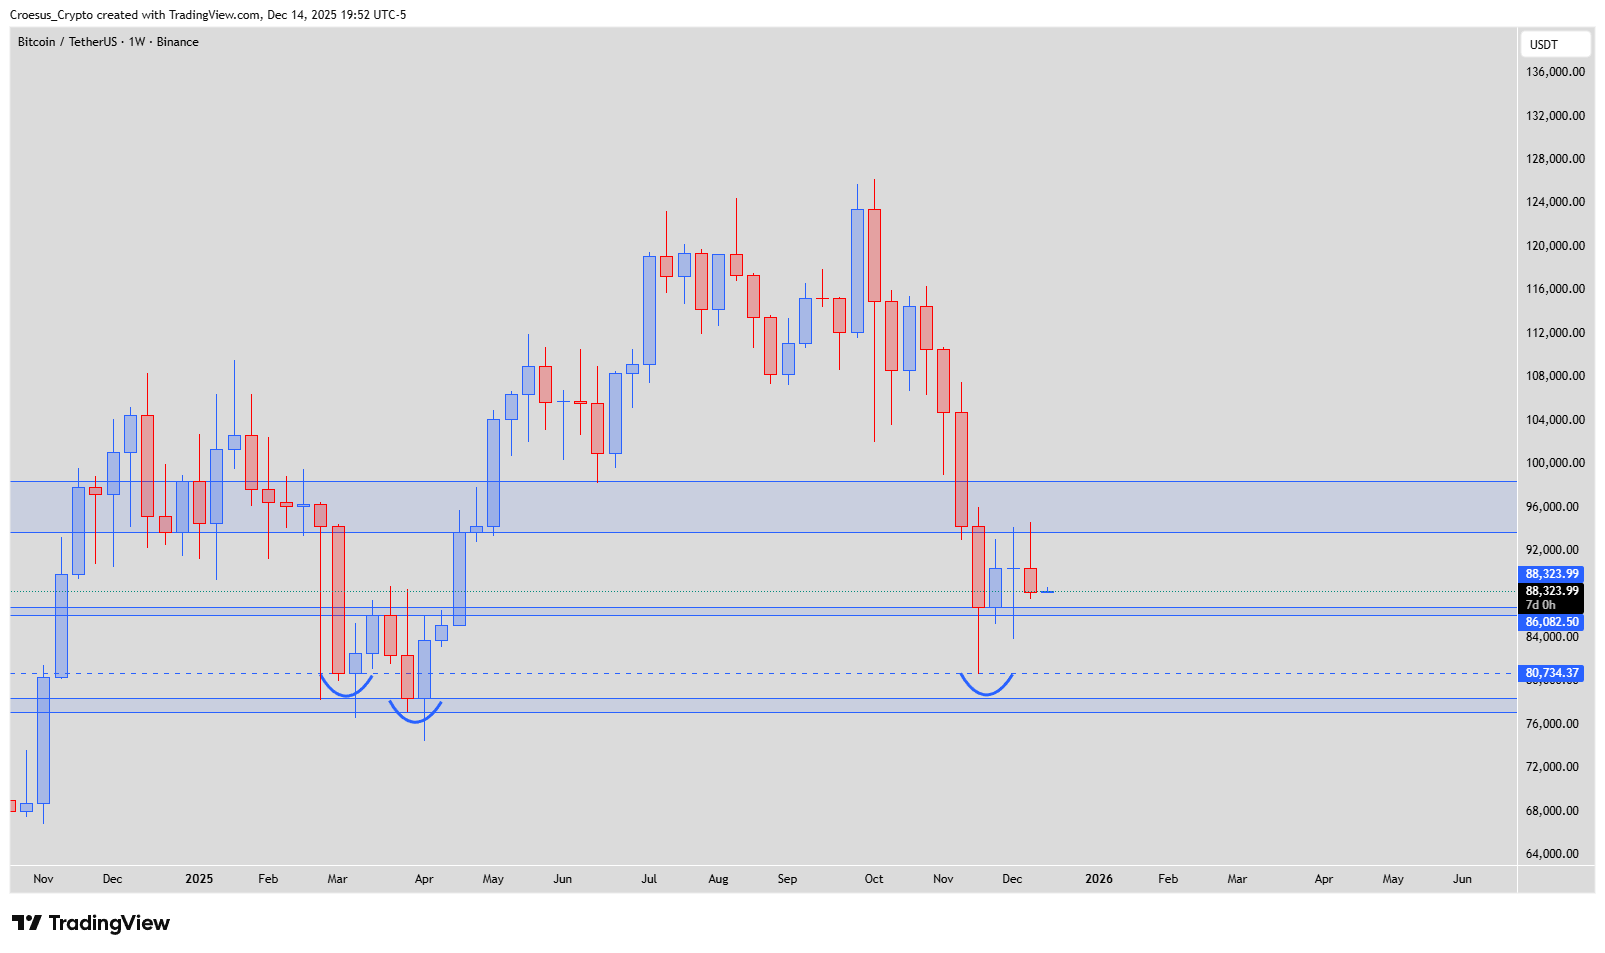
BTC weekly chart 2025 highlighting repeated retests of 80k demand zone and current consolidation below higher-timeframe supply.
Technical Analysis Key Points
- Price retested the supply zone again but got rejected, indicating that it might now look for new liquidity, at least in the lower demand zone.
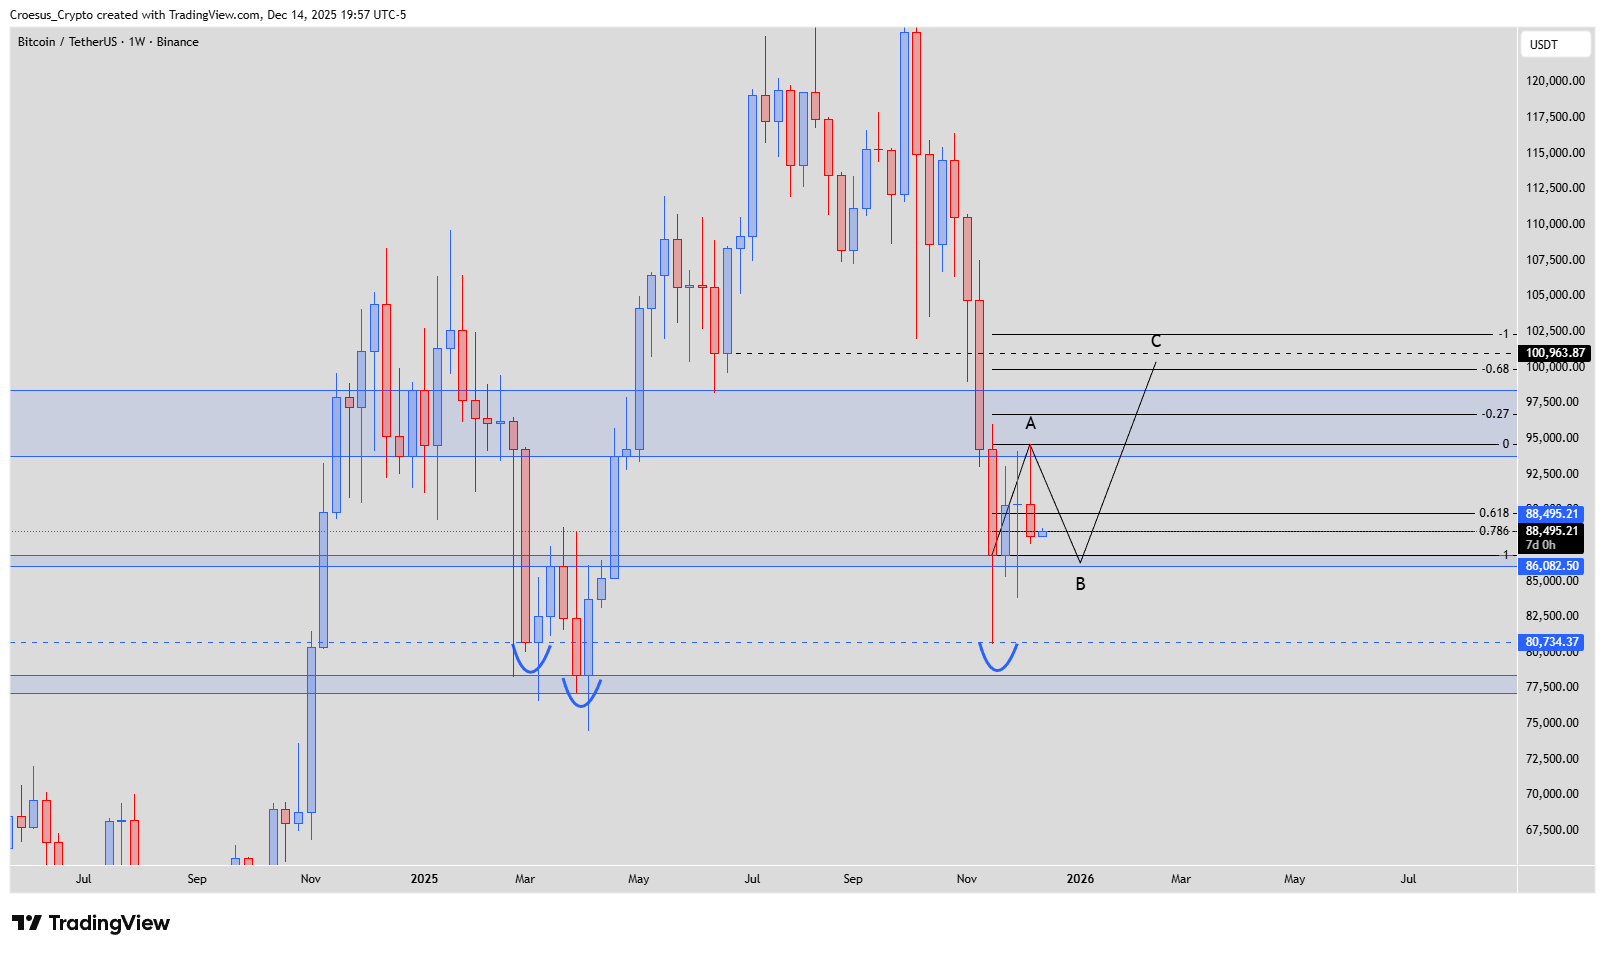
- This could signal the formation of an ABC correction of the last bearish impulsive sell-off.
Market Structure Analysis
On the weekly timeframe, BTC is trading between a well-defined supply zone above and a strong demand zone around the prior swing lows.
The latest candle in week 50 rejects the upper supply band, reinforcing it as a major support resistance flip. Within this context, the prior move down is clearly impulsive, while current price action is overlapping and corrective, fitting an emerging ABC pattern.
The projected A leg is the bounce into supply that just failed; a move down into the lower demand zone would likely form the B leg. From there, a C leg rally back into the higher supply band would complete the structure and align with typical Fibonacci behavior, where B often probes the 0.618–0.786 retracement area before price extends higher. This BTC weekly analysis therefore treats the current range as a corrective consolidation within a broader bearish swing.
Key Levels and Scenarios
Potential ABC corrective scenario:
Rejection at weekly supply keeps the focus on liquidity lower; a drop into the lower demand zone around the previous wick lows (near the 80k region) would complete B.
If buyers defend that demand and reclaim mid-range prices, a C leg toward the upper resistance / prior breakdown zone could unfold, targeting the high-90k to low-100k band shown on the chart.
Key levels to watch
Weekly supply zone: origin of the latest rejection and A-leg high.
Mid-range support: interim reaction area inside the corrective structure.
Major demand around the prior lows (≈80k): potential B-leg low and liquidity pool.
Higher resistance / breakdown area: projected C-leg target and strong supply.
Trading Implications
This BTC weekly analysis favors treating current price action as range-bound: reactive strategies around demand and supply may offer better risk/reward than chasing moves in the middle of the range, with strict risk management in case the correction fails and trend continuation resumes early.
This analysis is not financial advice; always do your own research and manage your risk before trading.