

Our Bitcoin weekly analysis for week 52 December 2025 focuses on the impulsive bearish sell-off followed by the first signs of a bottoming pattern near the weekly low. This technical analysis suggests a potential corrective bounce, but within a still-dominant bearish environment.
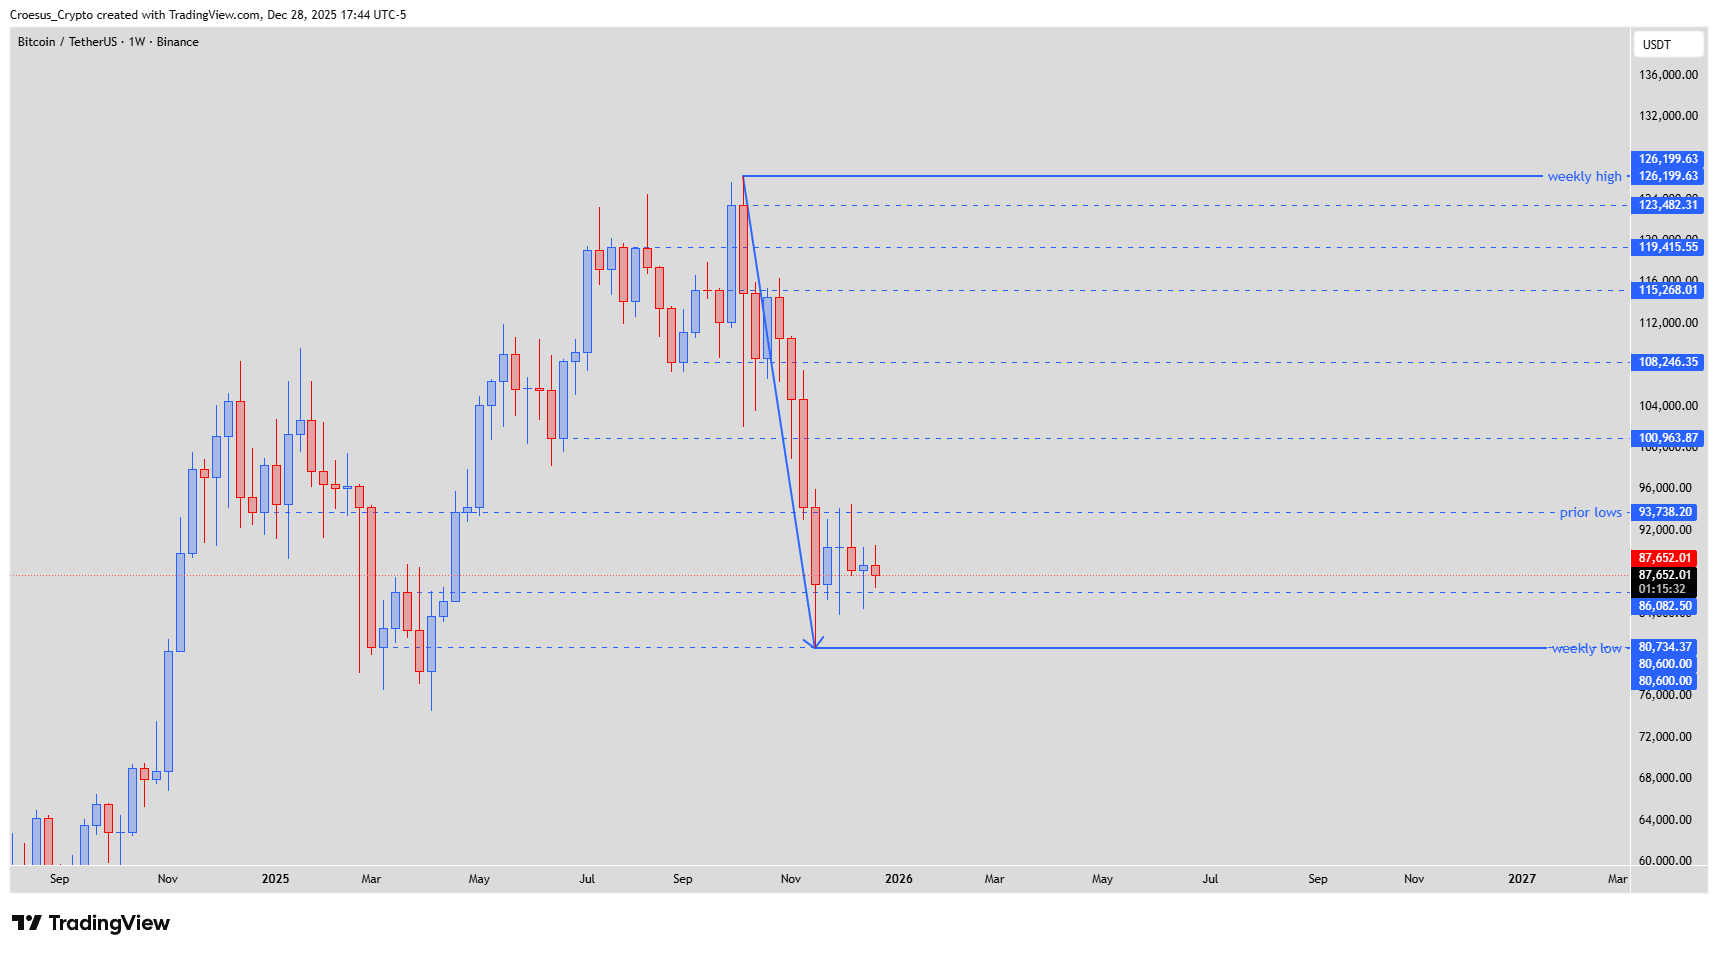
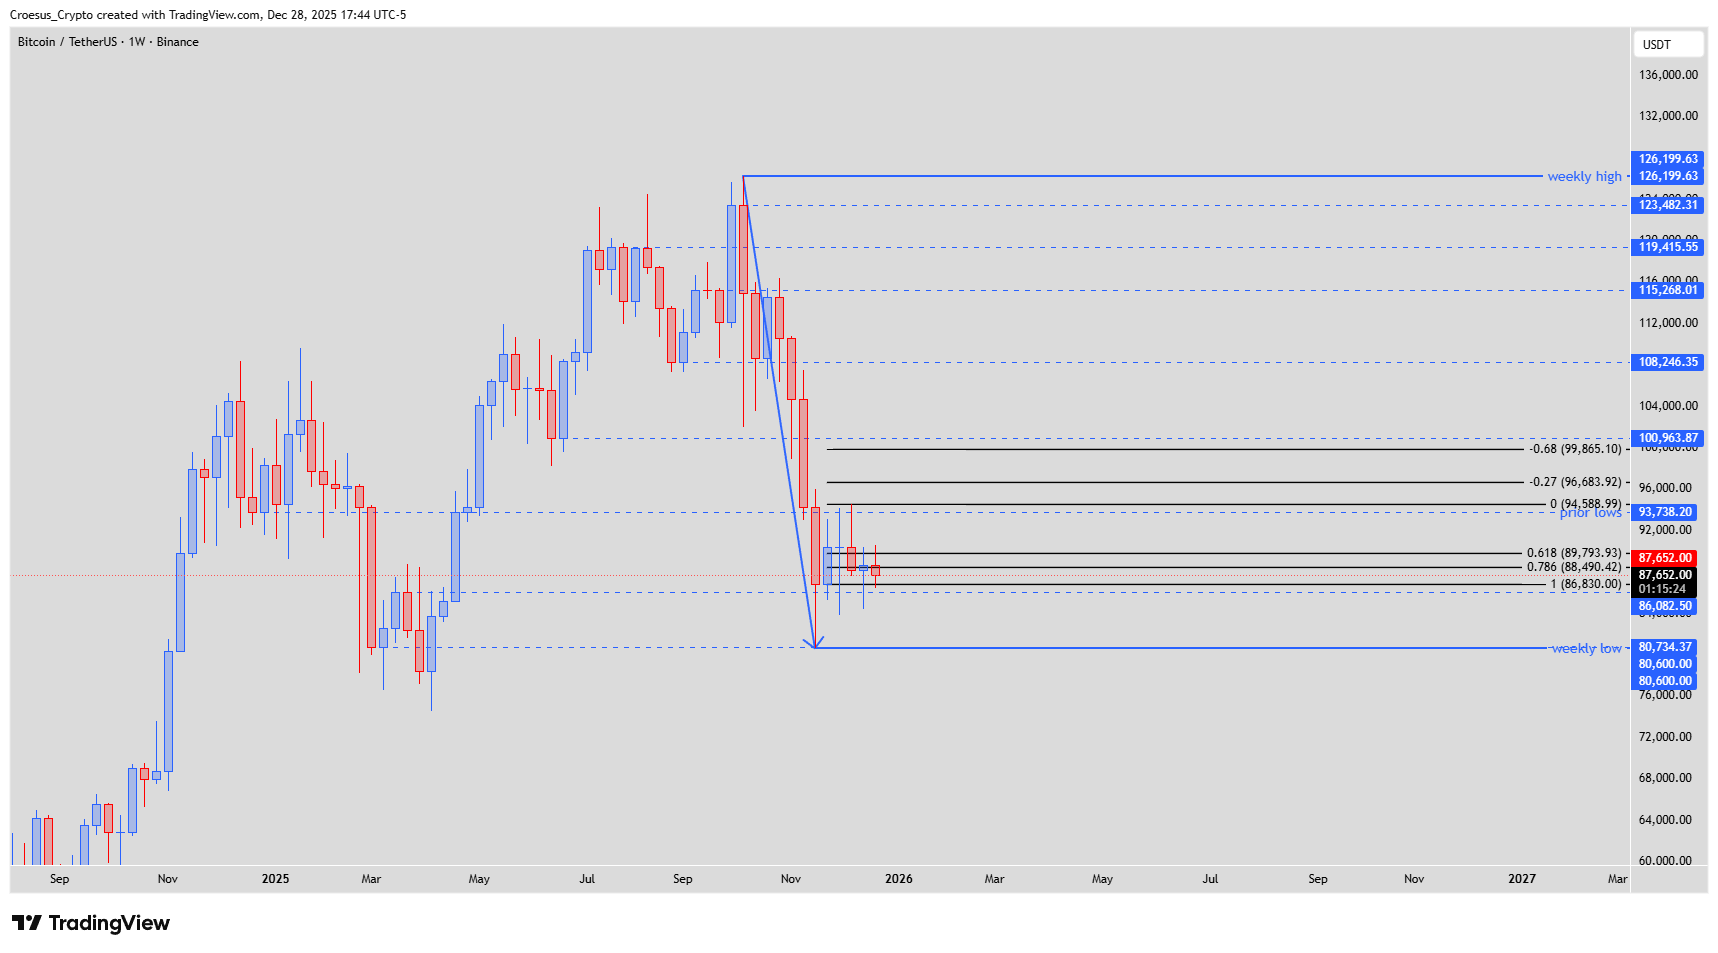
Bitcoin weekly chart week 52 December 2025 with prior highs, weekly low and potential ABC correction targets marked as support resistance zones.
Technical Analysis Key Points
- After the impulsive bearish sell-off we can see the first signs of a bottoming pattern.
- This could initiate a possible formation of an ABC correction of the bearish impulse.
- REMARK : eventhough this correction would be bullish, it is still to be considered as a correction of a bearish impulse. The predominating trend is still bearish.
- REMARK 2 : Eventhough we might start the ABC correction at this level, we can also go lower. As long as we don't close below the weekly low, there is no break of structure. We could still see a structural retest of the wick leading to the weekly low. Price could still move within the fake out zone.
Market Structure Analysis
On the weekly timeframe, Bitcoin prints a vertical bearish leg into the current support zone around the weekly low, followed by small-bodied candles suggesting absorption rather than immediate continuation. Our Bitcoin weekly analysis therefore treats this as a potential starting point of an ABC corrective structure.
The weekly low defines the main structural support; as long as weekly closes remain above it, the broader market structure is technically intact and the move up is considered corrective. Above price, prior weekly lows near the mid-90k region form key resistance and align with a Fibonacci 0.618–0.786 retracement cluster of the last impulse, creating a strong confluence of support resistance where sellers may step back in.
Key Levels and Scenarios
Bullish (corrective) scenario:
If buyers defend the weekly low and price holds inside the fake-out zone, an ABC corrective rally toward prior weekly lows and the Fibonacci retracement band becomes likely, still within a broader bearish leg.
Key levels to watch:
Weekly low (~80k): Structural support; weekly close below would confirm a fresh bearish breakout.
Fake-out zone (wick to candle close): Area where price can oscillate while forming the early legs of an ABC correction.
Current weekly closes (~86k–88k): First resistance and pivot for short-term direction.
Prior weekly lows (~93k): Major resistance and potential completion area for the corrective wave.
Trading Implications
Traders should treat any upside as a counter-trend move, focus on lower-timeframe confirmations for long entries, keep stops below the weekly low, and consider fading strength into higher resistance zones given the prevailing bearish trend and overall risk/reward.
This analysis is not financial advice; always do your own research and manage your risk before trading.