

BTC Marketcap / Bitcoin
Our Bitcoin weekly analysis for week 7 February 2026 shows a market in corrective mode, where the bearish impulse is losing strength while price trades back inside a prior consolidation range. Price action, support resistance and Fibonacci confluence are central in this technical analysis.
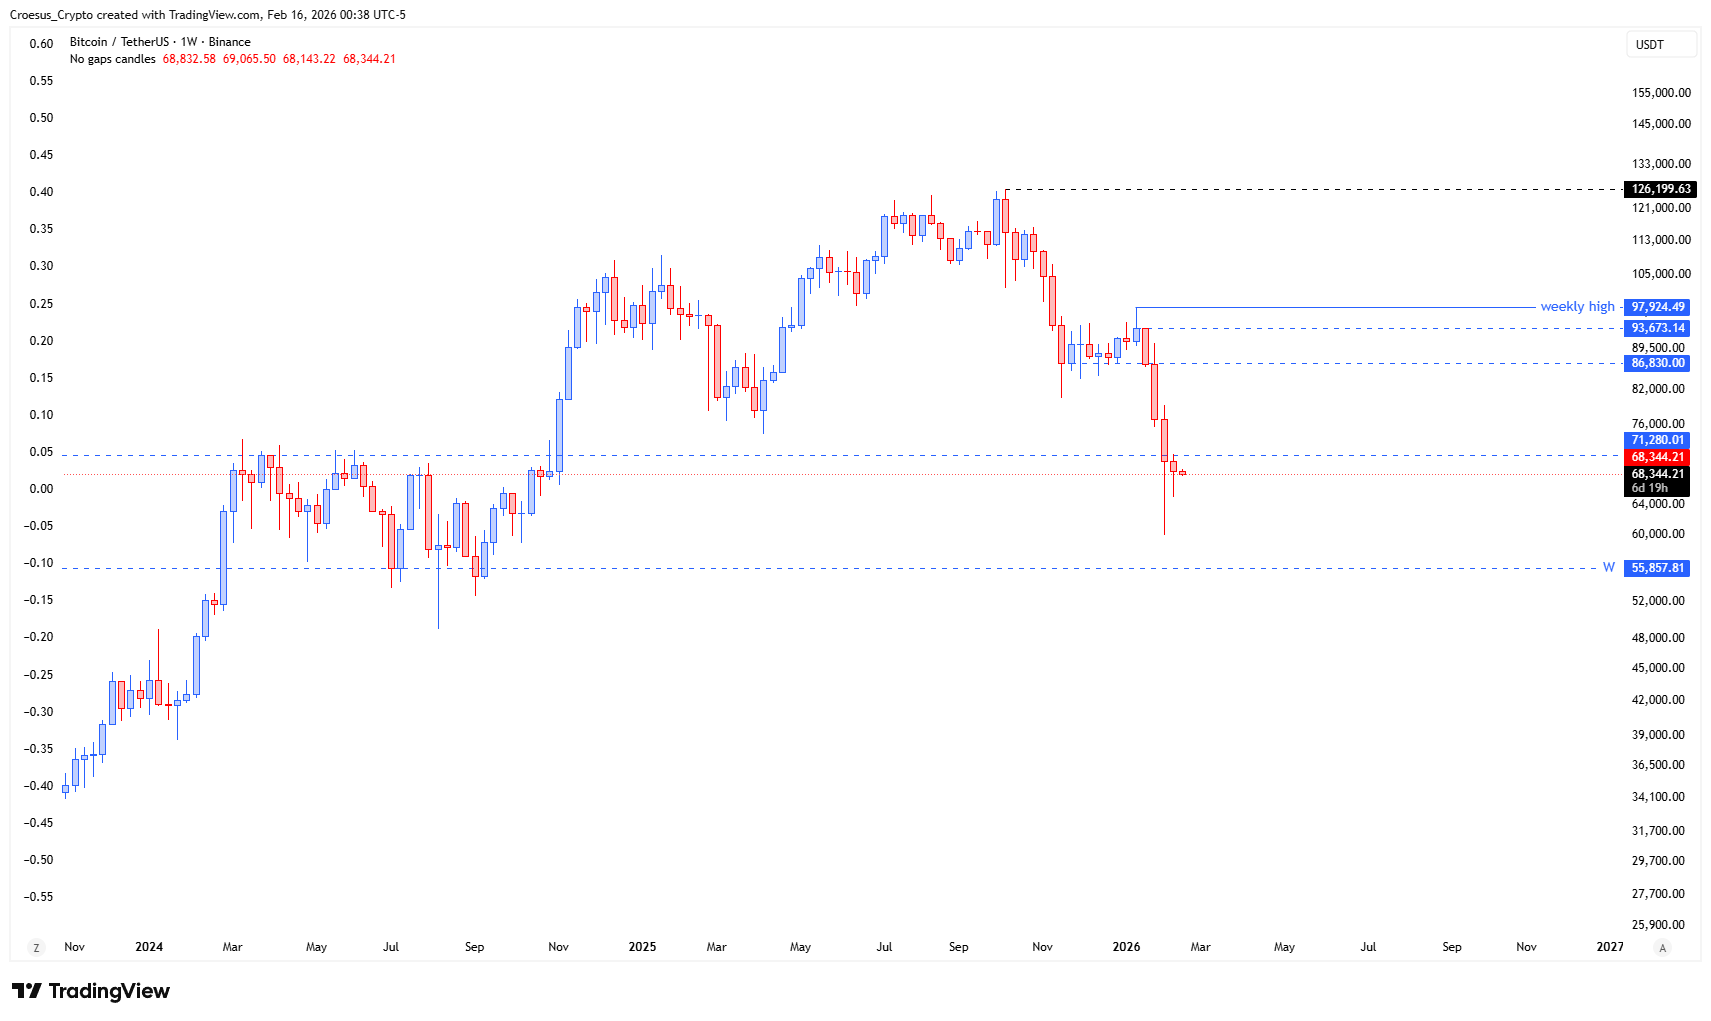
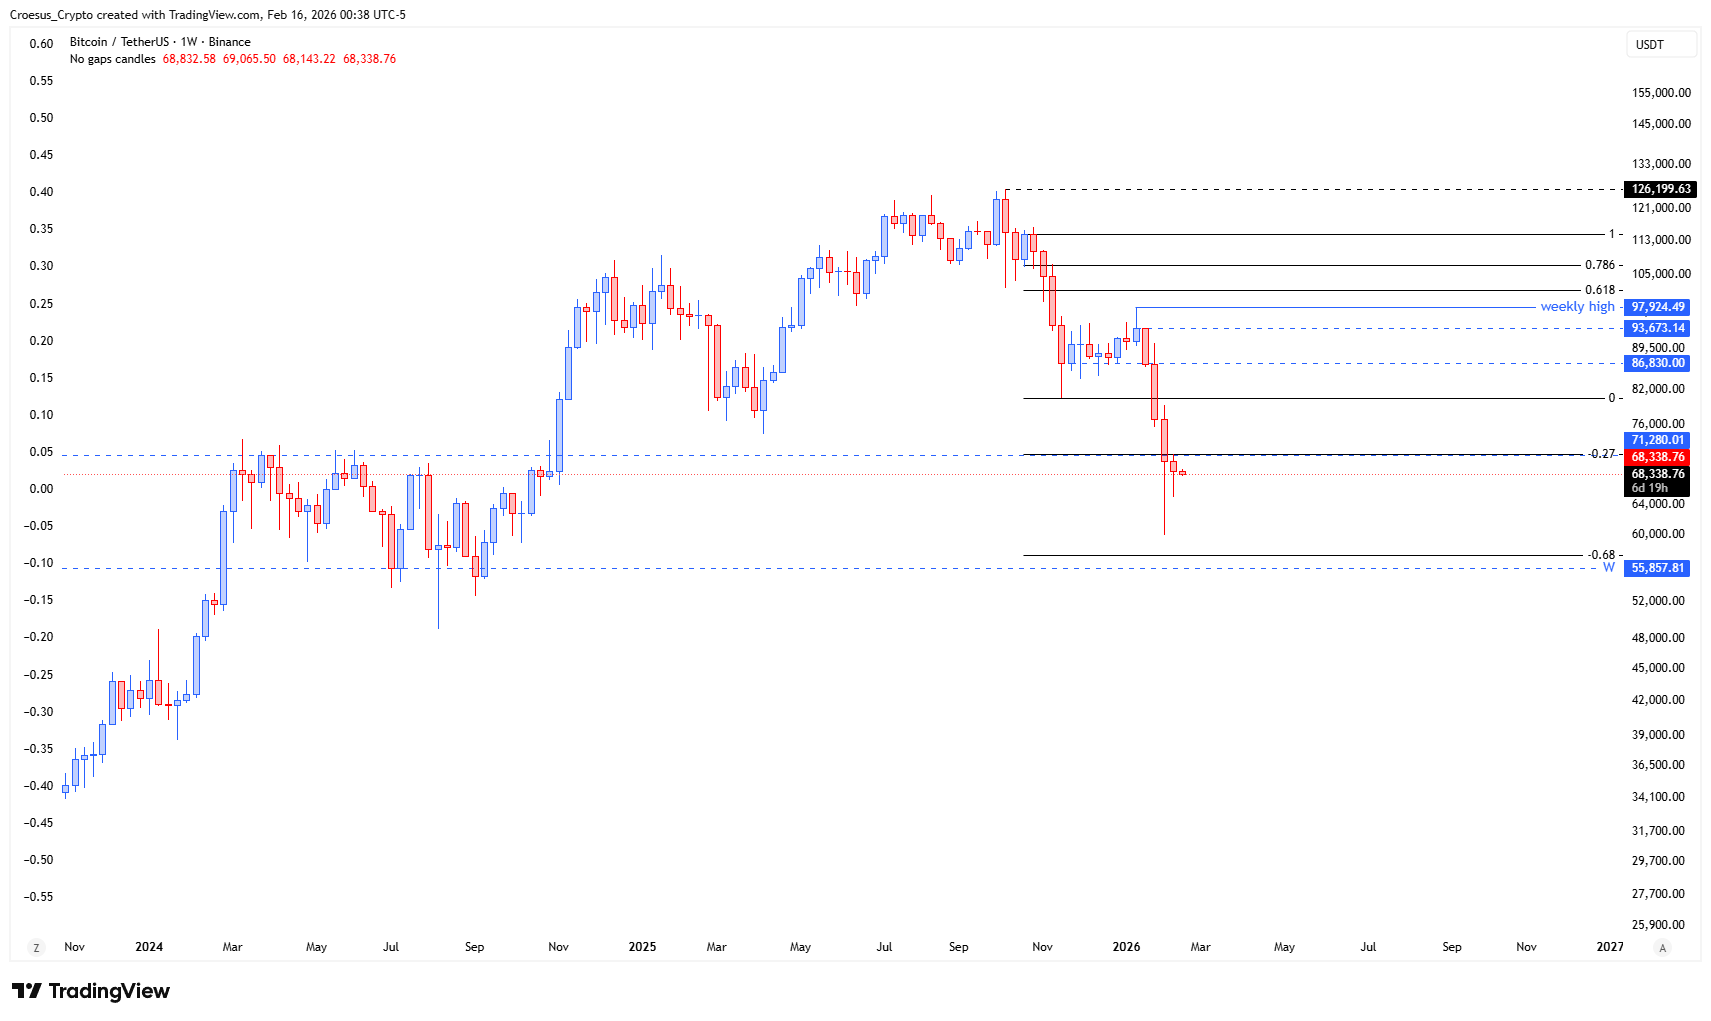
- Same as with the TOTAL weekly chart : we can see a momentum retest and last week the bearish impulse slowing down.
- The last candle did not close below the previous low
- We can not see a reversal yet but it indicates us that last week the bulls and bears were more or less in agreement.
- We have entered back into a previous consolidation zone. We saw a momentum retest of almost the entire range. As we already know, a momentum retest can be followed by a structural retest. This would mean that we can fill up the entire range again.
- If we look at the fib extension level -0.68, it aligns with the bottom of the range.
Market Structure Analysis
Structurally, BTC has broken down from the previous distribution, then sharply retraced into the old range, creating what we call a momentum retest of that structure. The slowdown of the bearish impulse and the fact that the last weekly candle did not print a new closing low signal seller exhaustion and a temporary equilibrium between buyers and sellers around current support resistance levels.
Re-entry into the prior consolidation is important: as long as Bitcoin holds inside this range, price can oscillate between its boundaries, offering both short-term trading opportunities and the potential for a full structural retest back to the range highs. The Fib extension level at -0.68 lining up with the range bottom provides an additional Fibonacci confluence zone where liquidity and reactive buying are likely to cluster if price revisits that area.ion.
Key Levels and Scenarios
Bullish scenario: bulls defend the mid-to-lower part of the range, keep weekly closes above the recent low and push price back toward the top of the consolidation. A full structural retest would mean refilling almost the entire range, with upside potential of several tens of percent from current levels if the move extends to prior weekly resistance.
Key levels to watch:
- Range bottom / Fib -0.68: strong downside support and major invalidation zone for the bullish range-fill idea.
- Current agreement zone around last week’s low/high: short-term pivot where candles are overlapping
- Mid-range level: first objective in any recovery, often used for partial profits or tighter risk management
- Range high / prior weekly high: main upside target if a structural retest plays out.
Trading Implications
Given the slowing downside momentum but lack of a confirmed reversal, we see this as a tactical trading environment where aggressive traders may play the range while conservative participants wait for clearer weekly confirmation before allocating larger position sizes or setting stops beyond the Fib -0.68 confluence.
This analysis is for informational purposes only and does not constitute financial advice.