

BTC Marketcap / Bitcoin
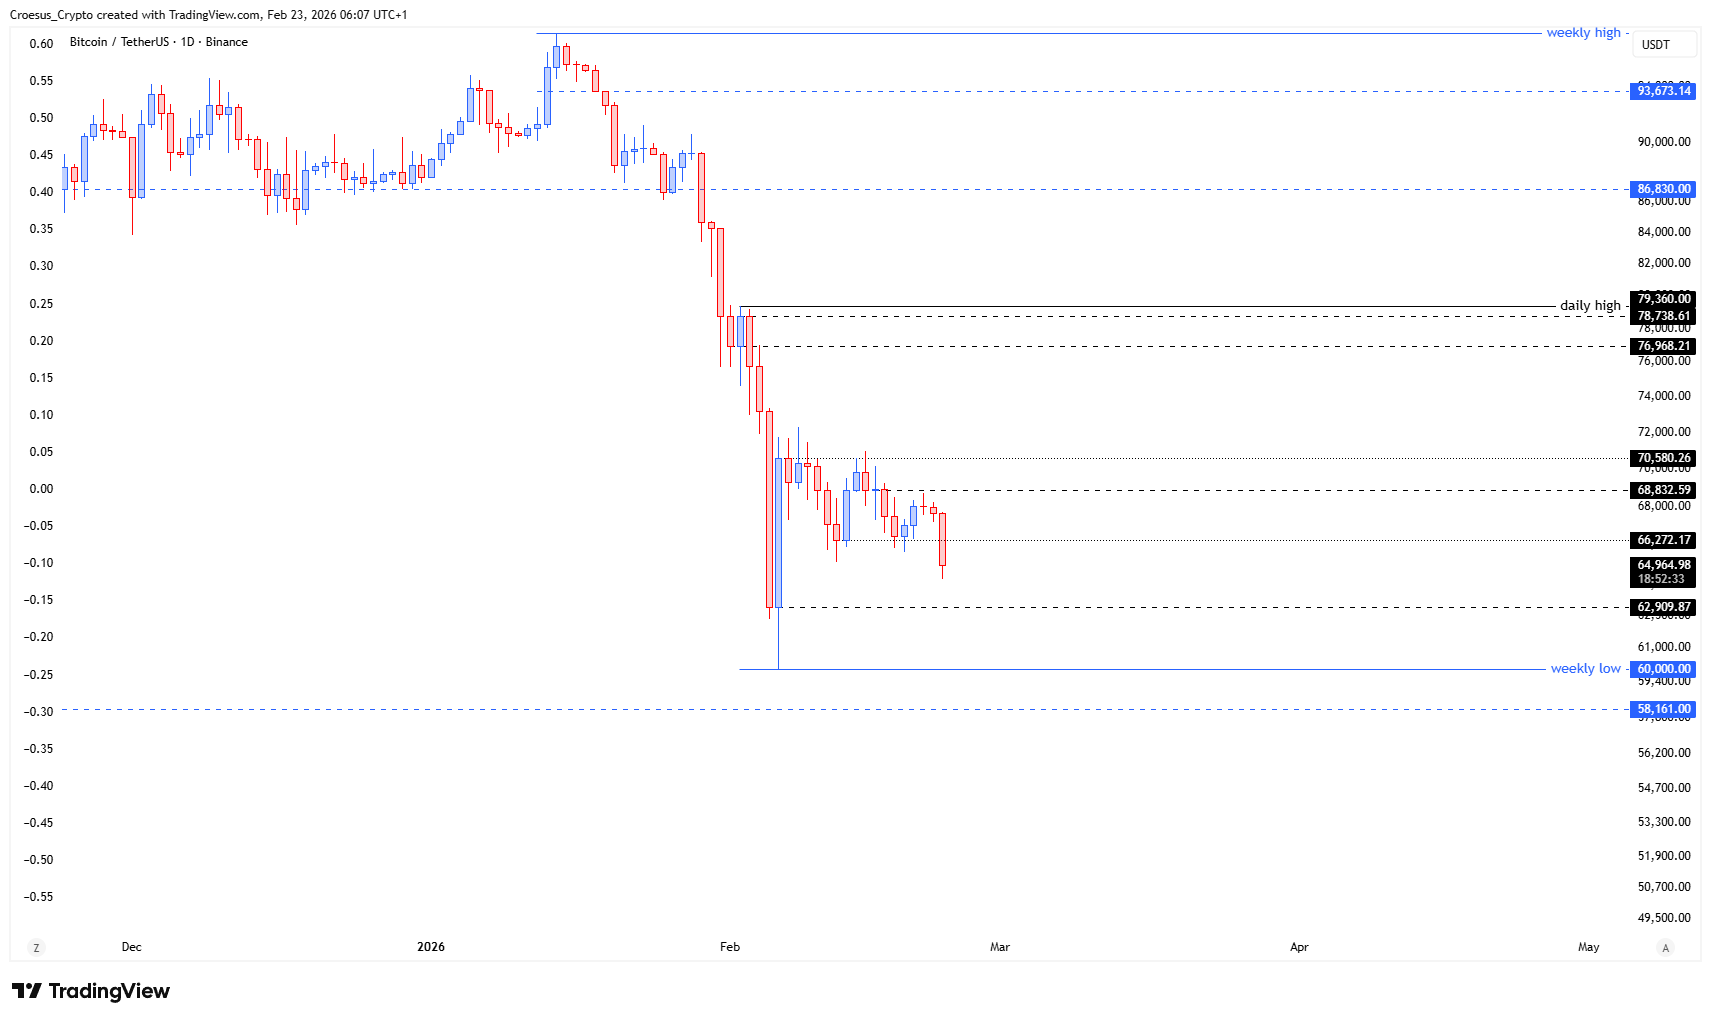
In this Bitcoin weekly analysis for week 8 February 2026, we see price still digesting January’s sharp breakdown. Our technical analysis highlights how the market is structurally retesting the large downside wick printed near the 60,000 USDT weekly support, while the daily timeframe continues to trace an ABC corrective structure inside this broader range.
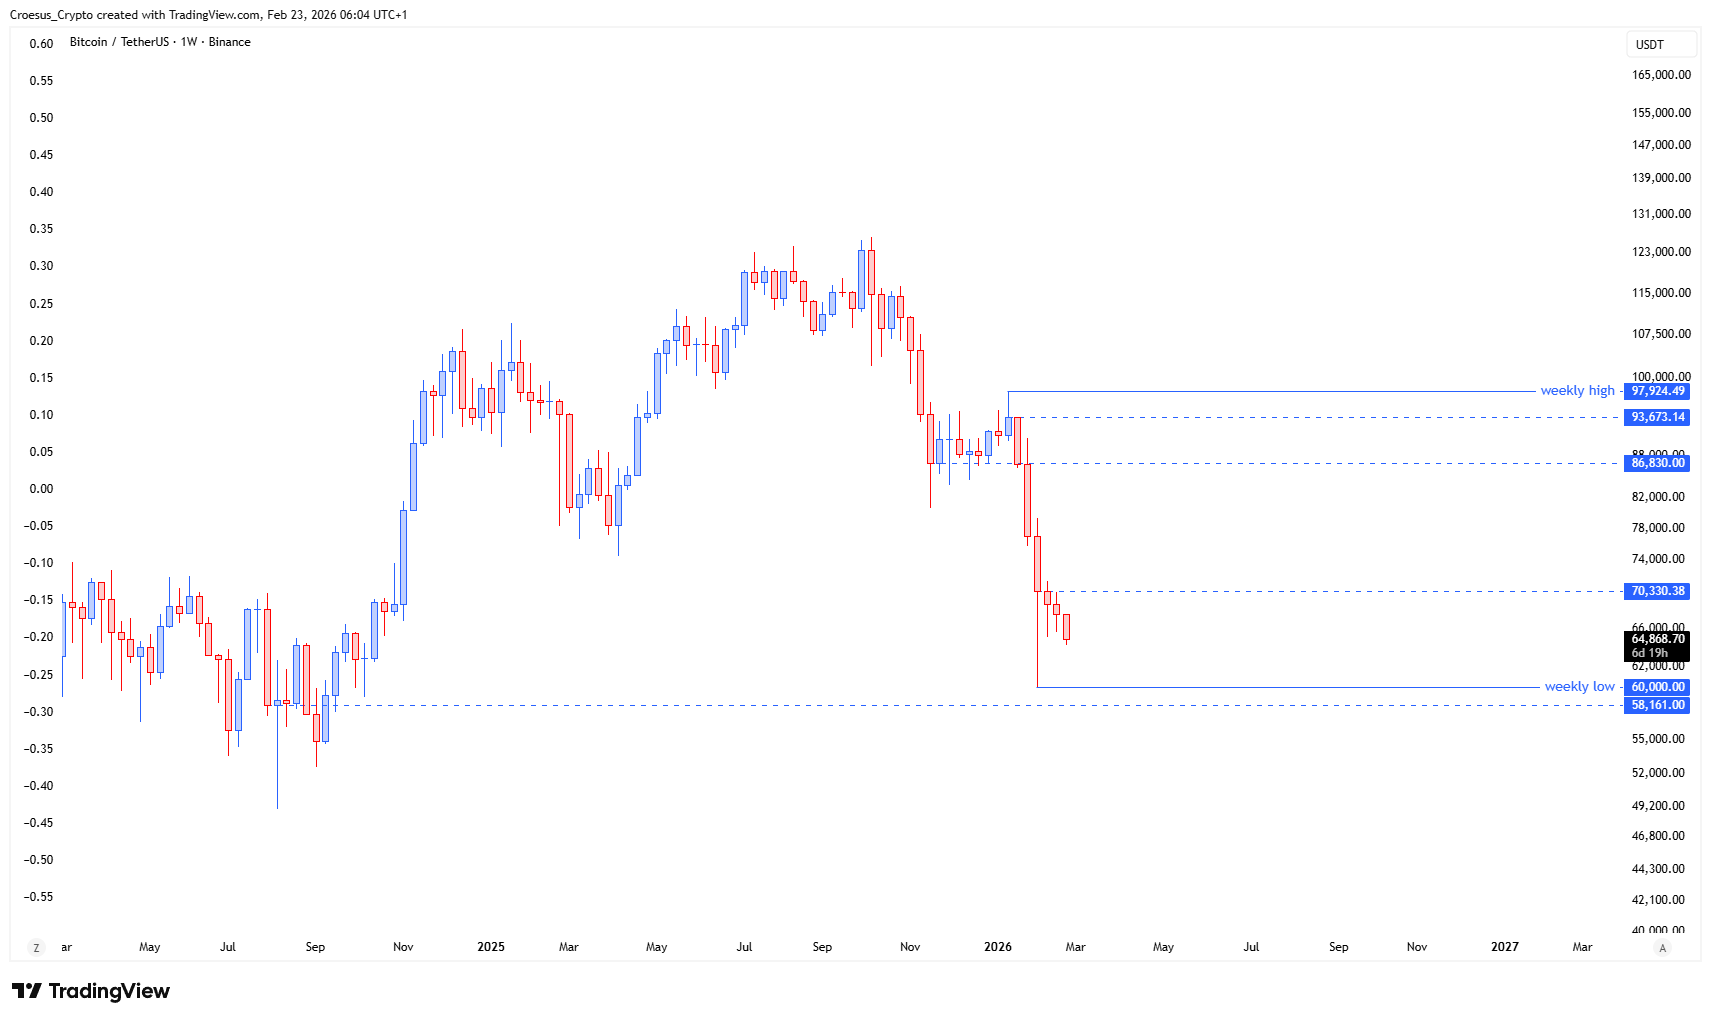
- Same as on the TOTAL : after the momentum retest, we see a structural retest of that wick.
- On the daily the ABC correction remains in play.
Market Structure Analysis
This Bitcoin weekly analysis mirrors the TOTAL market picture: a violent impulse down from the 90k–97.9k area, followed by a strong wick into the 60k–58,161 zone and now a slower, overlapping structural retest back into that wick. This behavior signals that immediate momentum has cooled, but sellers still control the support resistance band around 70,330–86,830. On the daily chart, price chops within an ABC correction between roughly 62,900 and 70,500, keeping both upside continuation and a deeper flush on the table. Traders can refine their zones by adding Fibonacci retracements over the last weekly impulse to align with these structural levels.
Key Levels and Scenarios
Bullish scenario: if buyers defend 60,000 and reclaim 70,500 on a closing basis, the ABC correction could resolve higher, targeting 76,000–79,300 first, then the 86,830 and 93,673 resistance cluster, with potential extension toward the prior 97,924 weekly high.
Key levels to watch:
- $97,924–93,673 – weekly high zone and major upside target.
- $86,830 – key resistance; first strong barrier if momentum returns.
- $70,500 / 70,330 – mid-range pivot; break and hold above favors bulls.
- $64,900–62,900 – daily corrective support area inside the ABC pattern.
- $60,000–58,161 – weekly low and critical structural support; loss opens further downside.
Trading Implications
From a trading perspective, we see asymmetric opportunities around the 60k–70k band: conservative traders may wait for confirmation above 70,500 before sizing into longs, while short setups remain valid against the 70,500–76,000 resistance area with stops placed beyond invalidation and position sizing aligned with predefined risk limits.
This analysis is for informational purposes only and does not constitute financial advice.