

BTC Marketcap / Bitcoin
BTC weekly analysis Week 9 2026. Bitcoin remains in a bearish environment, but our BTC weekly analysis highlights slowing price action as the move loses displacement and starts consolidating around a key structural area.
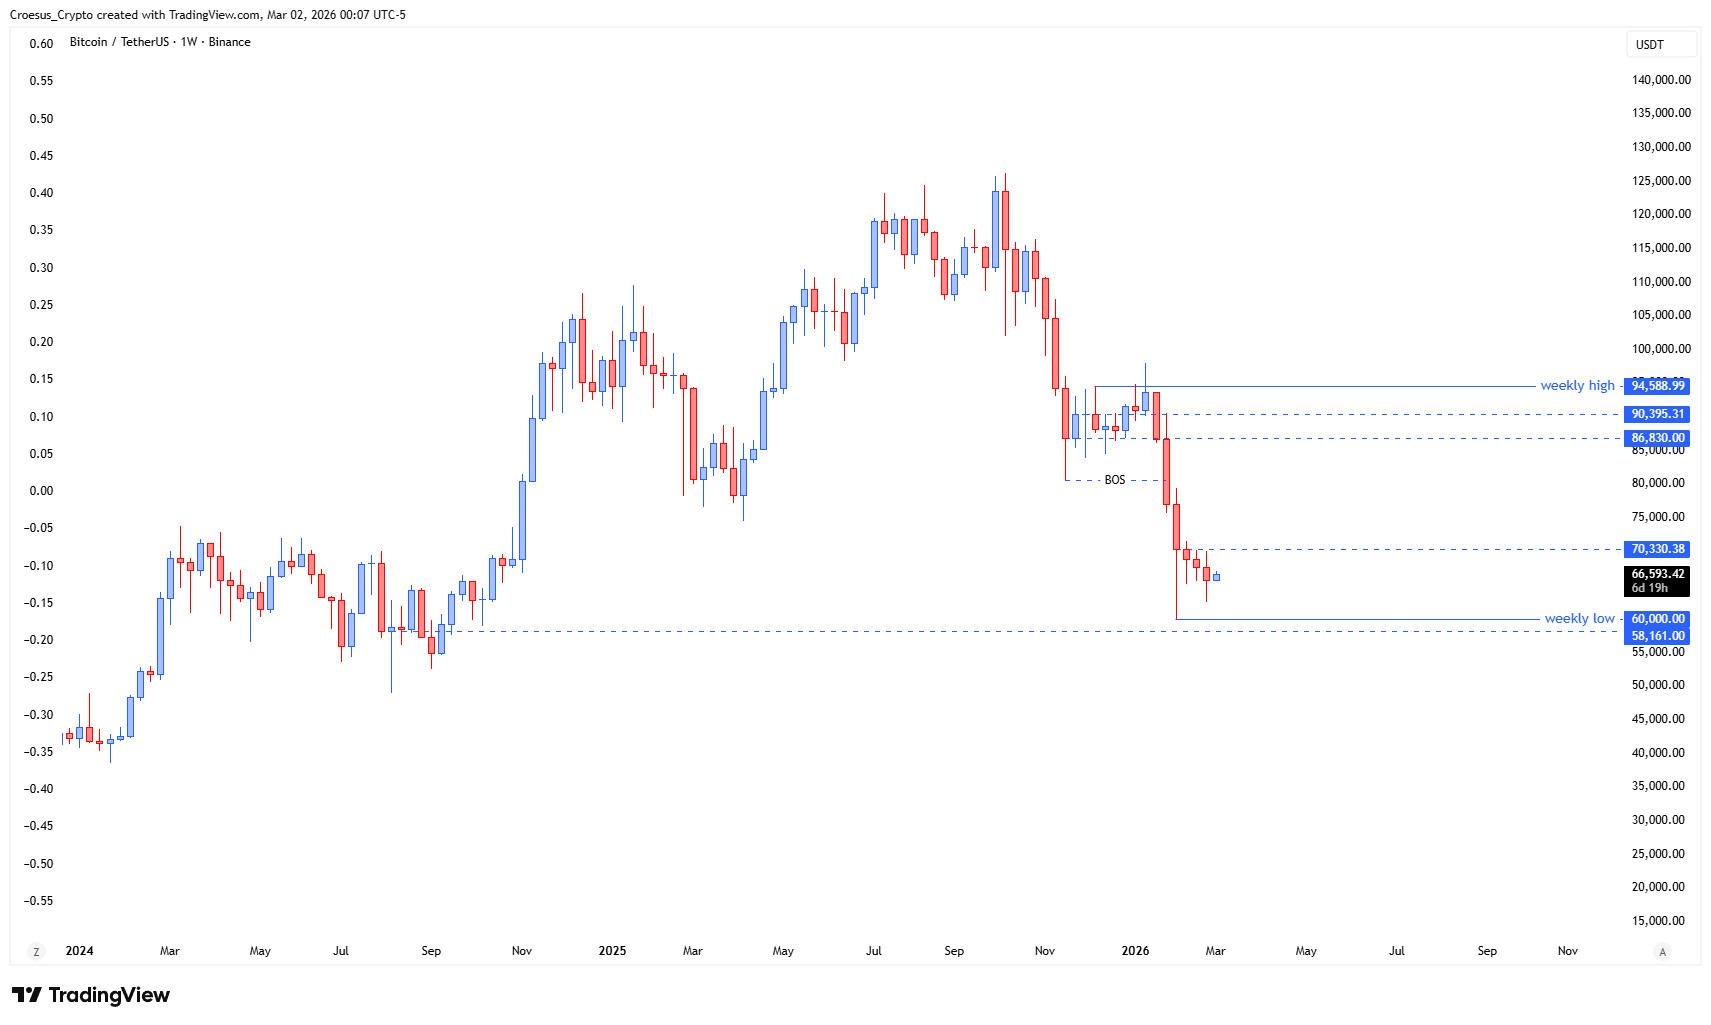
- BTC shows us also that price is slowing down and is moving inside the fake out zone, structurally retesting the key level
- The impulsivity has left, we see smaller, overlapping candles which tells us that bulls are trying to convince bears to change sides.
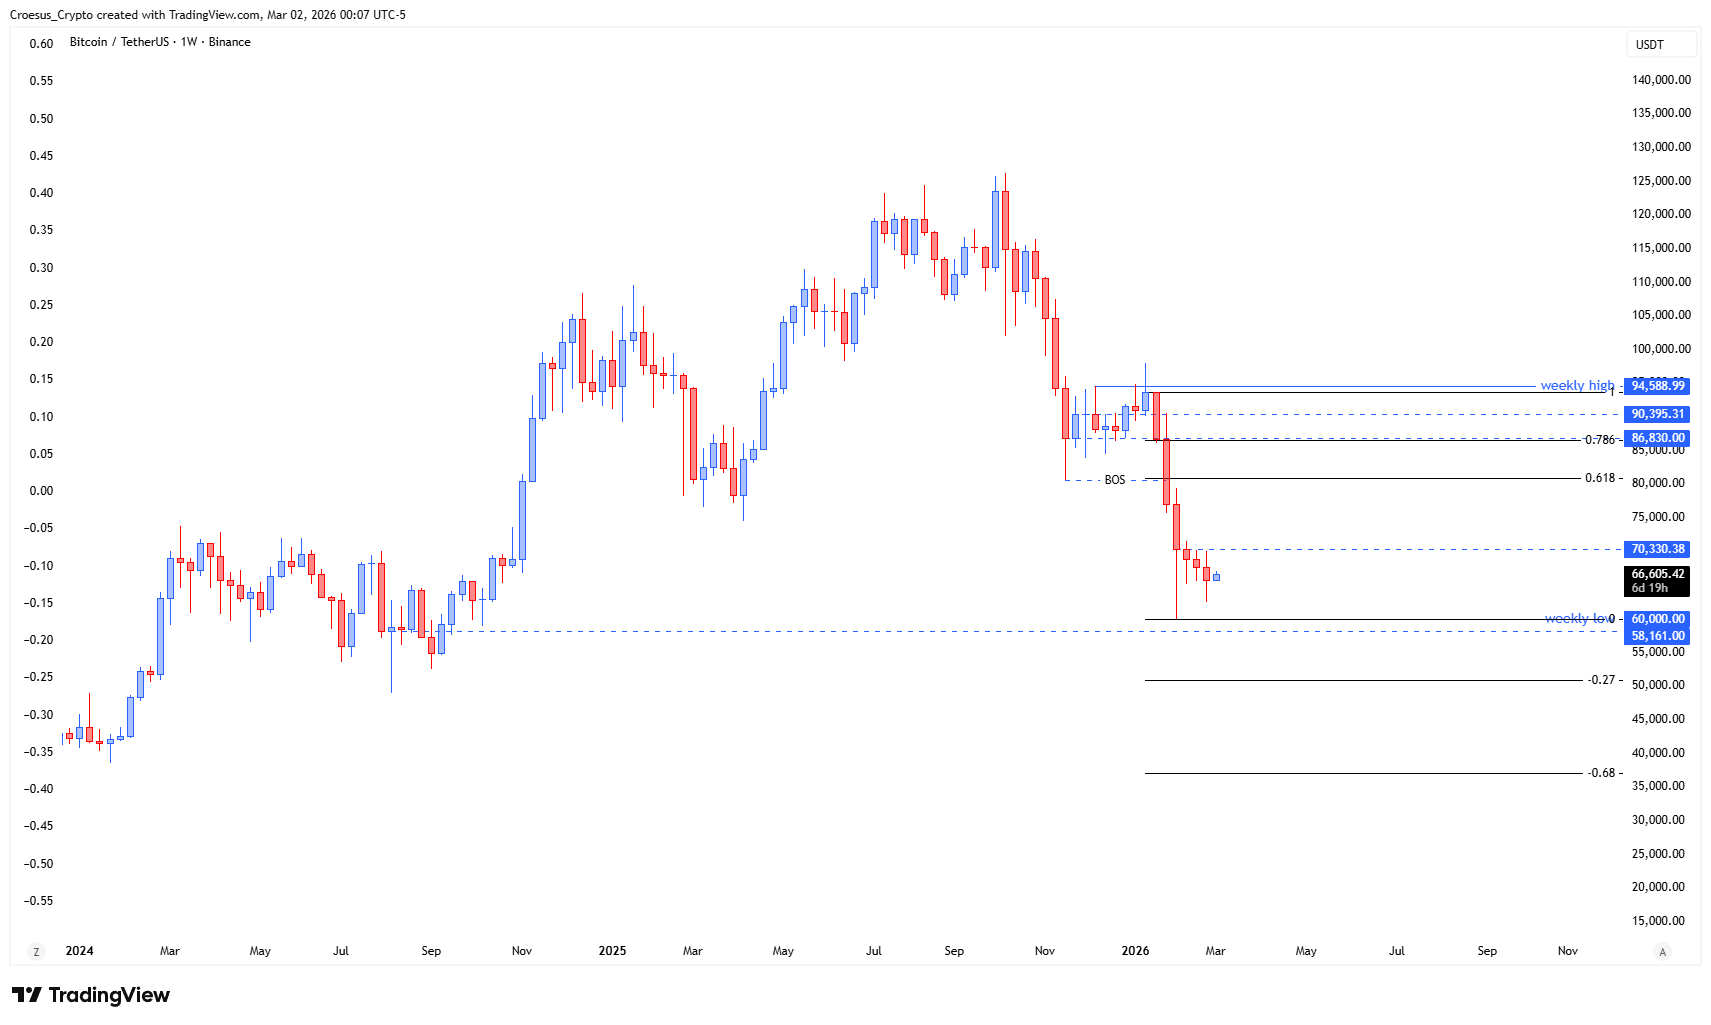
Market Structure Analysis
From a naked trading perspective, the key information is location and candle quality. Price is trading inside the “fake out zone” while retesting the key level, and the bearish impulse shows signs of exhaustion as weekly candles become smaller and overlap.
In a bearish PHASE 4 (prolonged impulse), this often marks a transition from clean continuation into a corrective structure: sellers are no longer able to push price away from the level with the same efficiency, while buyers are active enough to slow the move and create balance.
Structurally, this is the type of zone where the market either accepts below the key level (continuation lower), or reclaims it and starts building a base (trend weakening). The fact that bulls are “trying to convince bears to change sides” fits with a potential shift from aggressive selling to two-sided auction and compression.
Key Levels and Scenarios
The weekly structure is decision-driven around the key level and the boundaries of the fake out zone. A bearish continuation scenario requires rejection at the key level and acceptance back through the lower side of the zone, signalling that the retest is acting as resistance. A bullish corrective scenario requires a reclaim of the key level followed by holding above it on the weekly close, suggesting the fake out zone is converting into support.
- Key level being retested (primary decision point for acceptance vs rejection)
- Fake out zone high (reclaim level that would signal buyers gaining control)
- Fake out zone low (acceptance level that would favour bearish continuation)
- Current weekly consolidation range boundaries (break and retest confirms direction)
Trading Implications
With impulsivity fading on the weekly timeframe, conditions typically become more rotational and prone to wicks. Aggressive traders often focus on breakdown/breakout attempts at the range edges, while conservative traders generally wait for a weekly break and retest to confirm direction around support resistance.
This analysis is for informational purposes only and does not constitute financial advice.