

BTC Marketcap / Bitcoin
BTC quarterly analysis Q1 2026. Bitcoin prints a structurally heavy quarterly close as price breaks a prior swing low, shifting the market into a clearer bearish environment while still distinguishing a change of character from a full trend reversal.
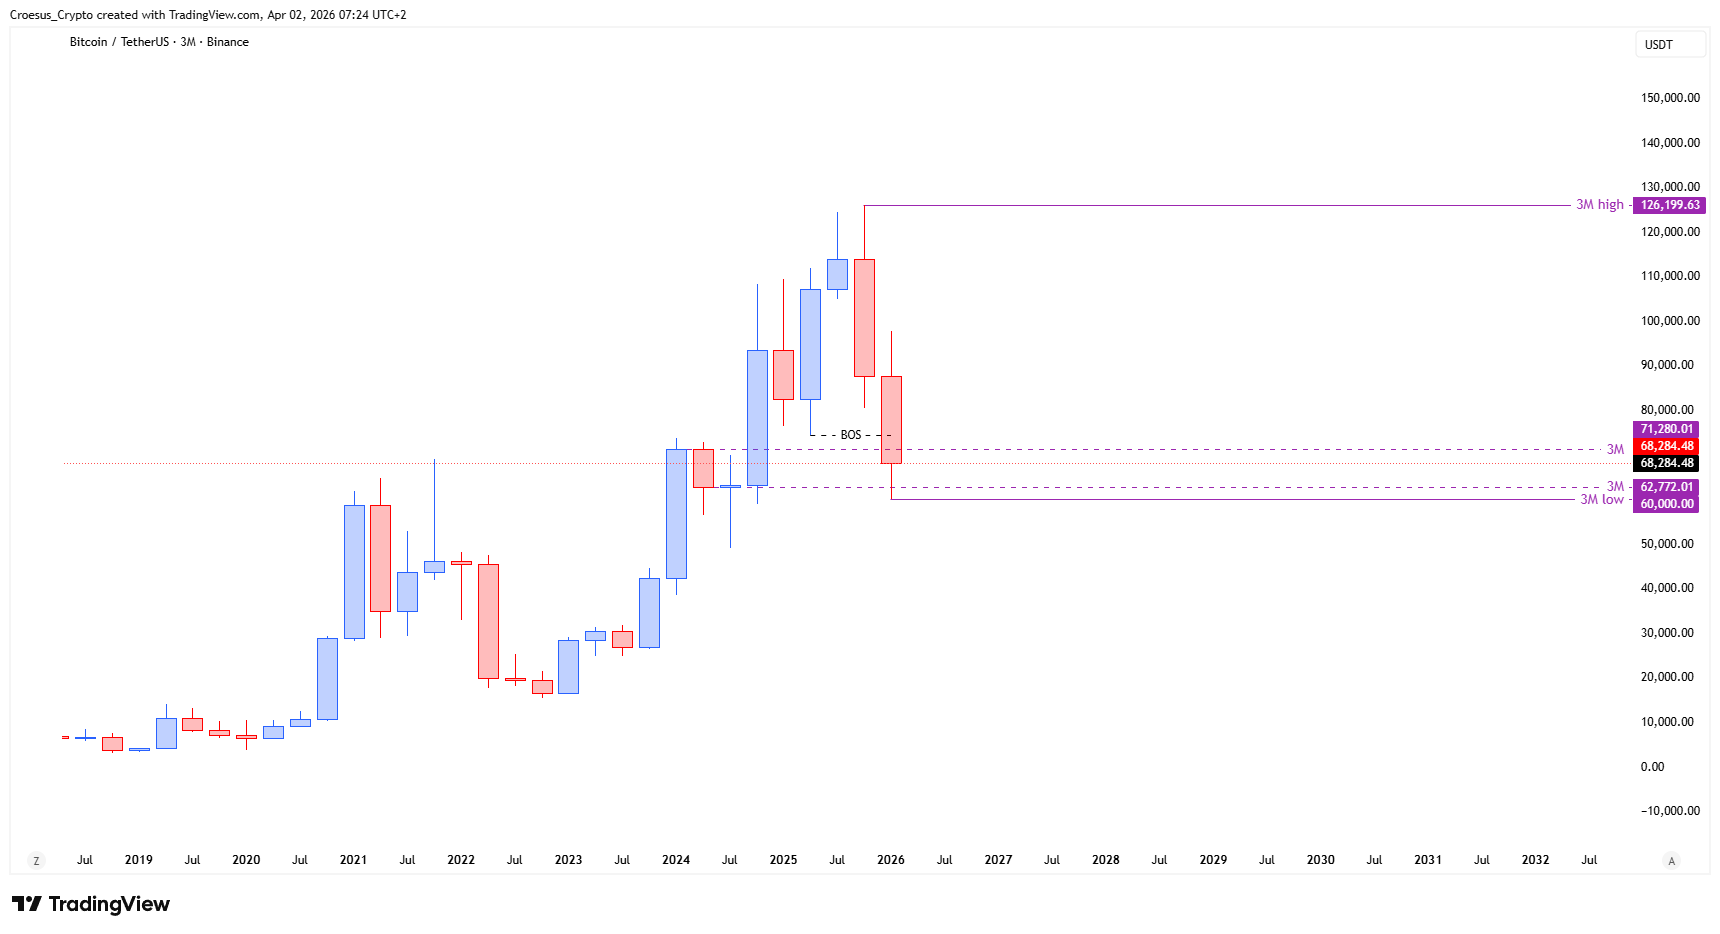
- BTC quarterly candle close shows us that price broke the swing low for the first time, creating a first time break and a change of character (not a change of trend).
- Bulls defended the 3M level @ 62.722,01 $, but failed to do so on the 71.280,01 $ level, creating a 3M range.
- In order to defend this level as support, we need to see, within the next 3 months, a reversal on the lower timeframes, showing us that bulls are willing to step back in again.
Market Structure Analysis
This BTC quarterly analysis highlights a first-time break of the swing low, which is a key market structure event. Structurally, that type of break often signals that downside liquidity has been taken and that prior demand is no longer holding cleanly, even if it does not automatically confirm a complete trend flip.
With bulls defending $62.722,01 but failing at $71.280,01, the chart is defining a clean 3-month range where horizontal support resistance becomes the primary decision framework. The upper boundary acts as the range high where sellers have proven control, while the lower boundary remains the line bulls must protect to prevent continuation lower.
Key Levels and Scenarios
Bearish continuation remains favored while BTC holds below the range high and fails to reclaim prior structure. A more constructive outcome requires bulls to hold the defended base and then show a lower-timeframe reversal within the next 3 months, signalling a reclaim attempt back into the range rather than acceptance below it.
- $62.722,01: 3M support bulls defended; key level to avoid bearish continuation
- $71.280,01: failed defense and range high; major resistance to reclaim for any recovery
- Broken quarterly swing low: structural inflection point; reclaim would neutralize the immediate bearish change of character
Trading Implications
From a naked-trading perspective, our focus stays on range behavior and clean horizontal reactions. Aggressive traders typically look for confirmation around range extremes, while conservative traders often wait for acceptance back above resistance or a clear reversal structure on lower timeframes before assigning higher conviction.
This analysis is for informational purposes only and does not constitute financial advice.