

Our Bitcoin quarterly analysis and yearly analysis focus on how 2025 closed with a strong rejection and how the current 3M structure is reacting around major Fibonacci and support resistance levels. The yearly candle shows clear supply above, but on the quarterly chart price still trades within a broader bullish structure after a full retracement to the impulse base.
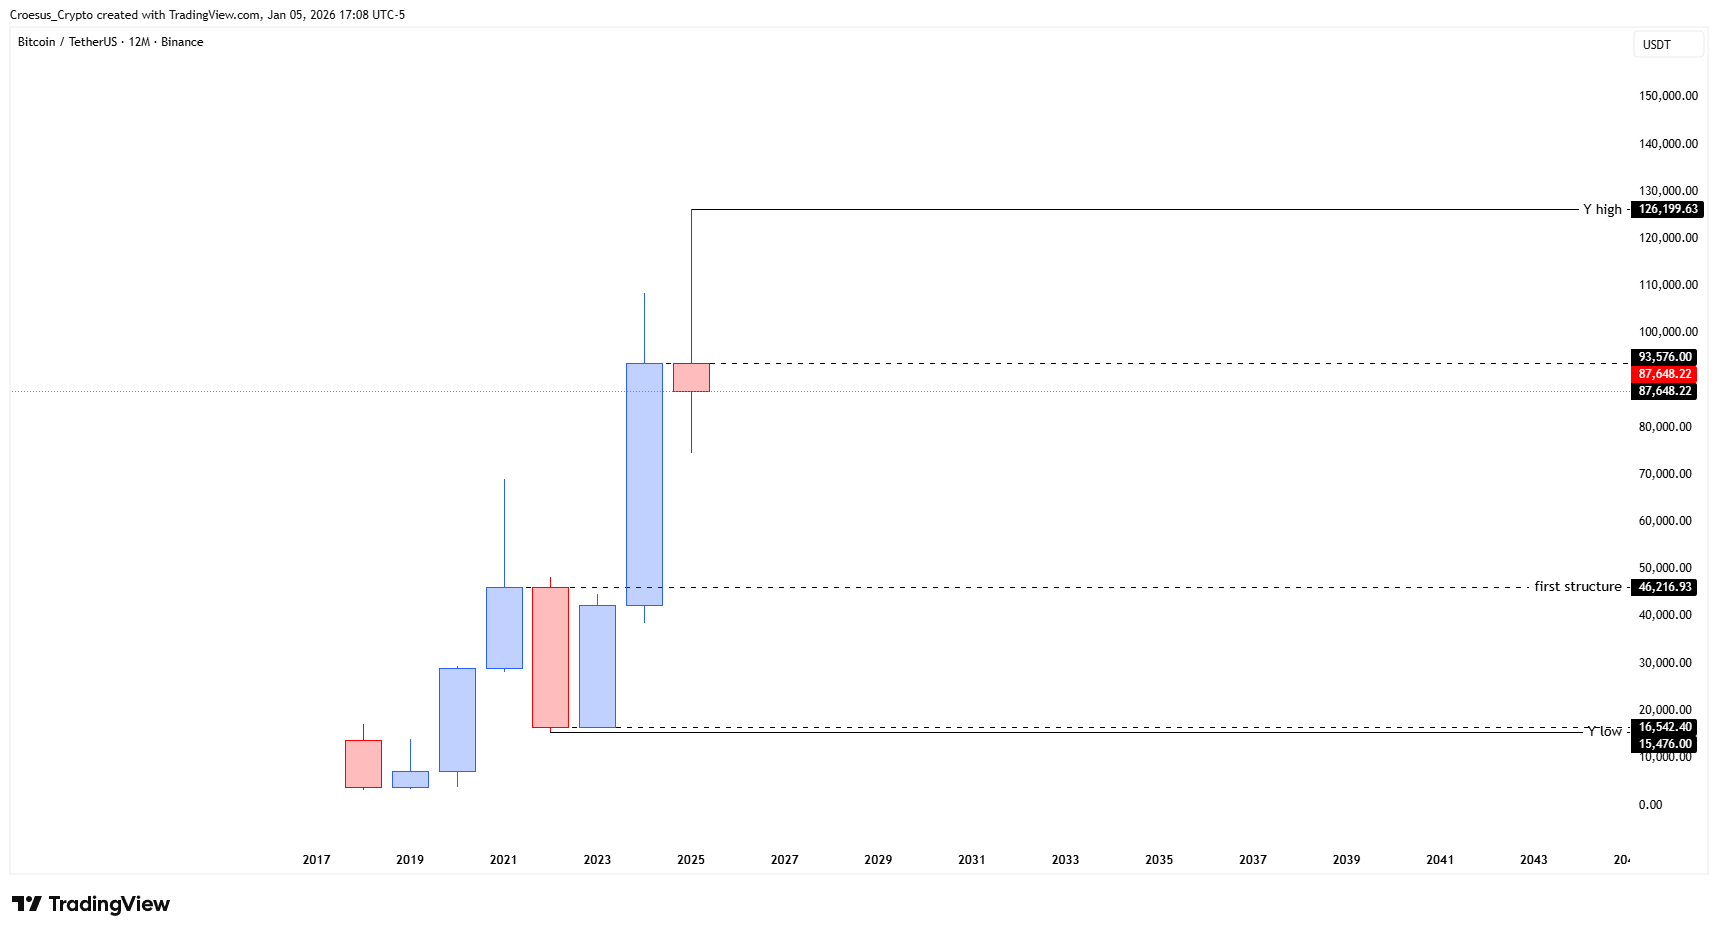
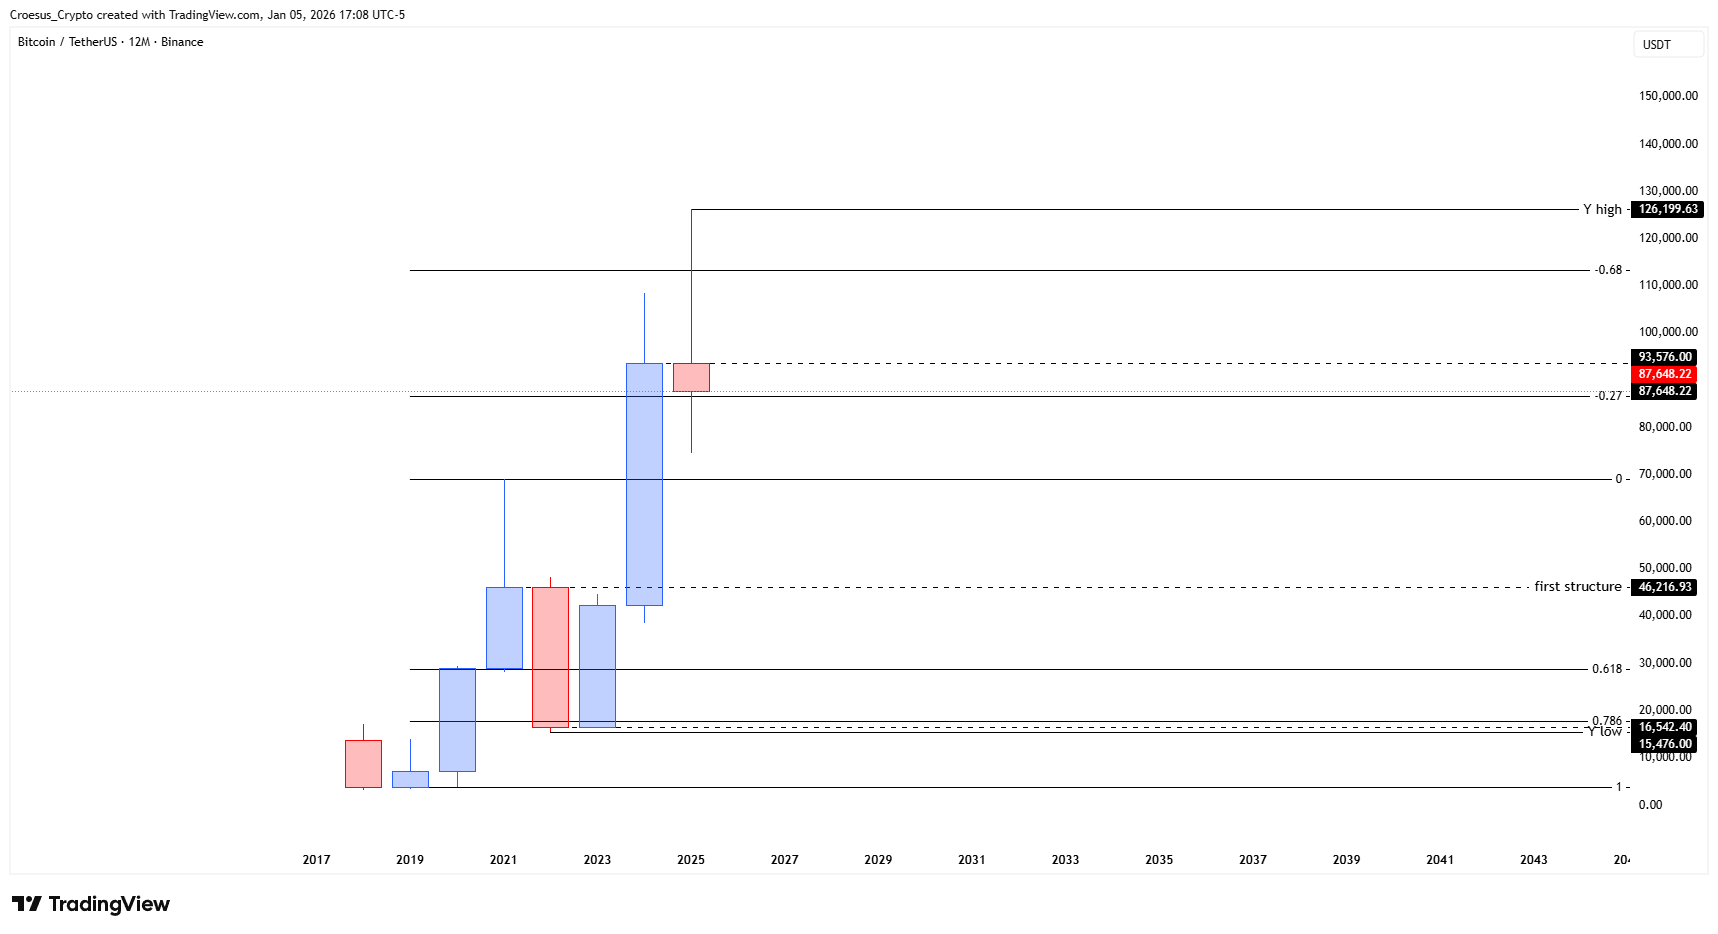
Bitcoin yearly (12M) chart January 2026 with large rejection wick from 93,576.00, first structure at 46,216.93 and rounded low at 15,476.00 plus Fibonacci extension levels.
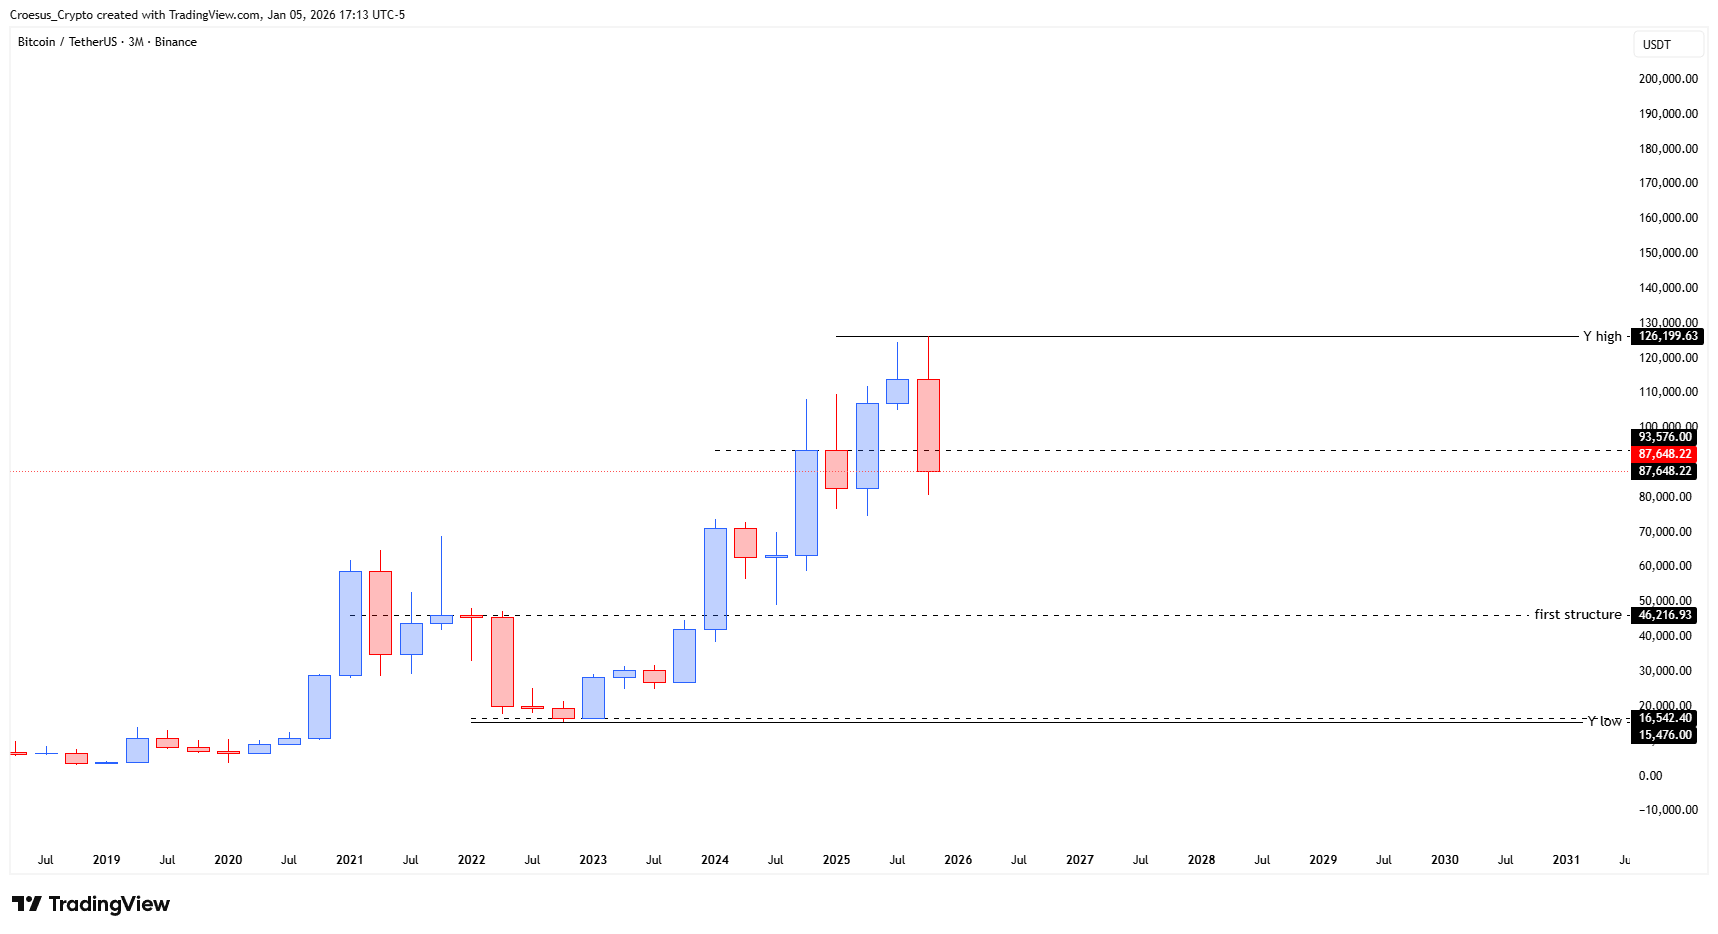
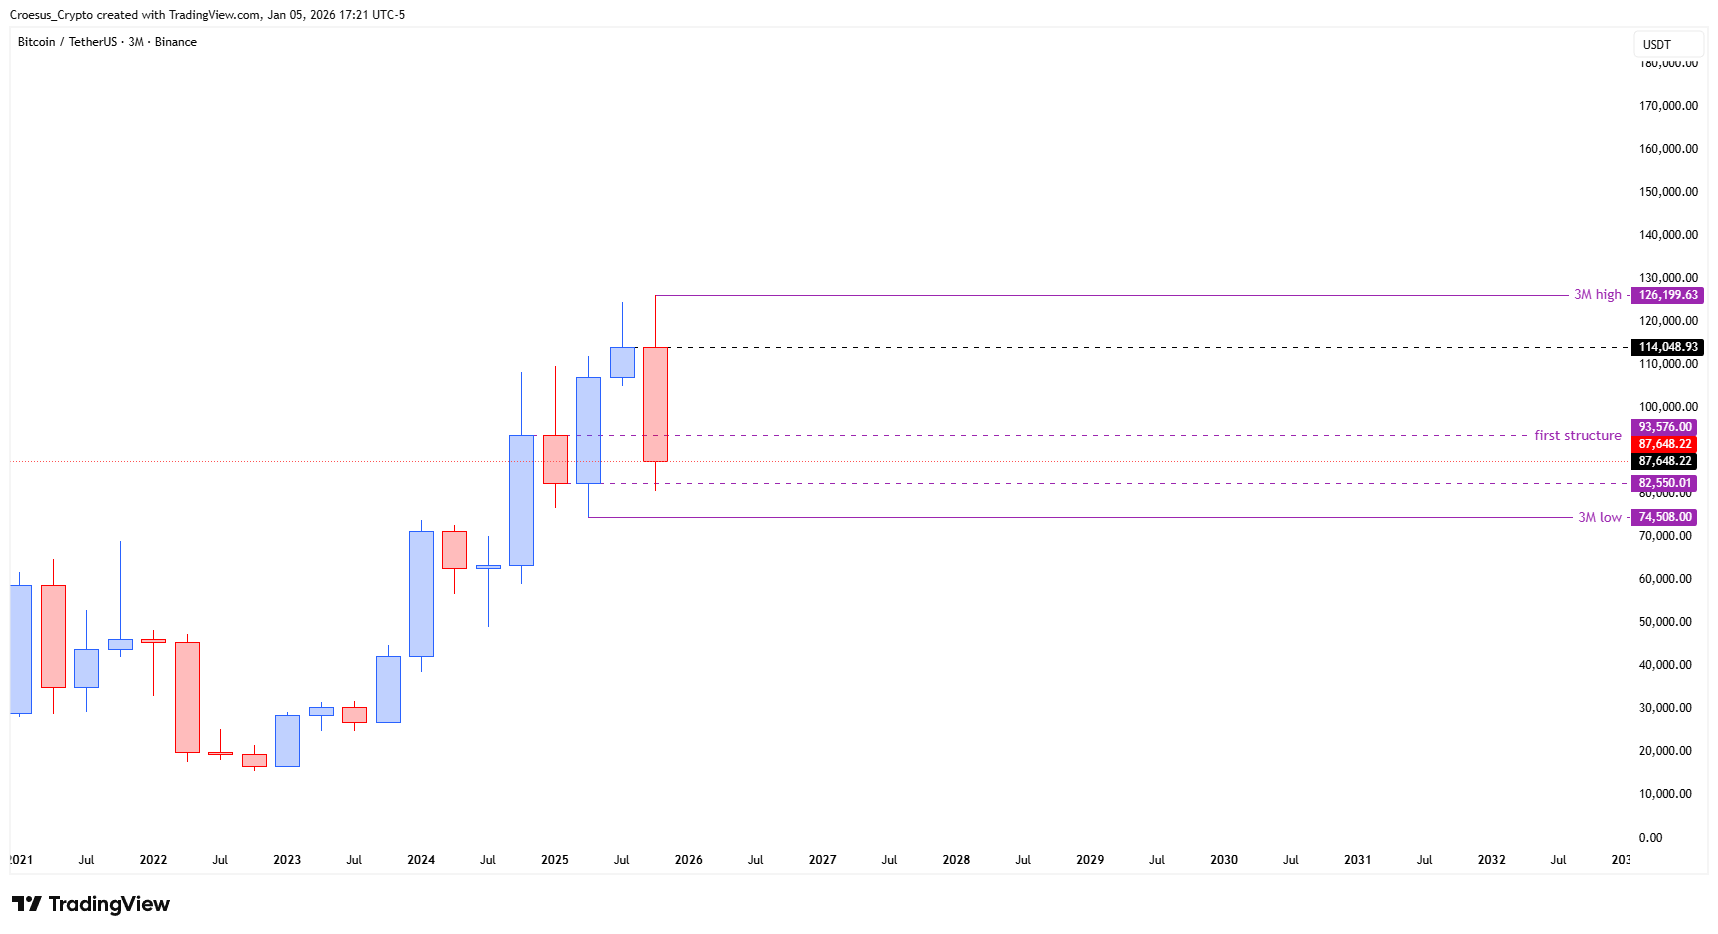
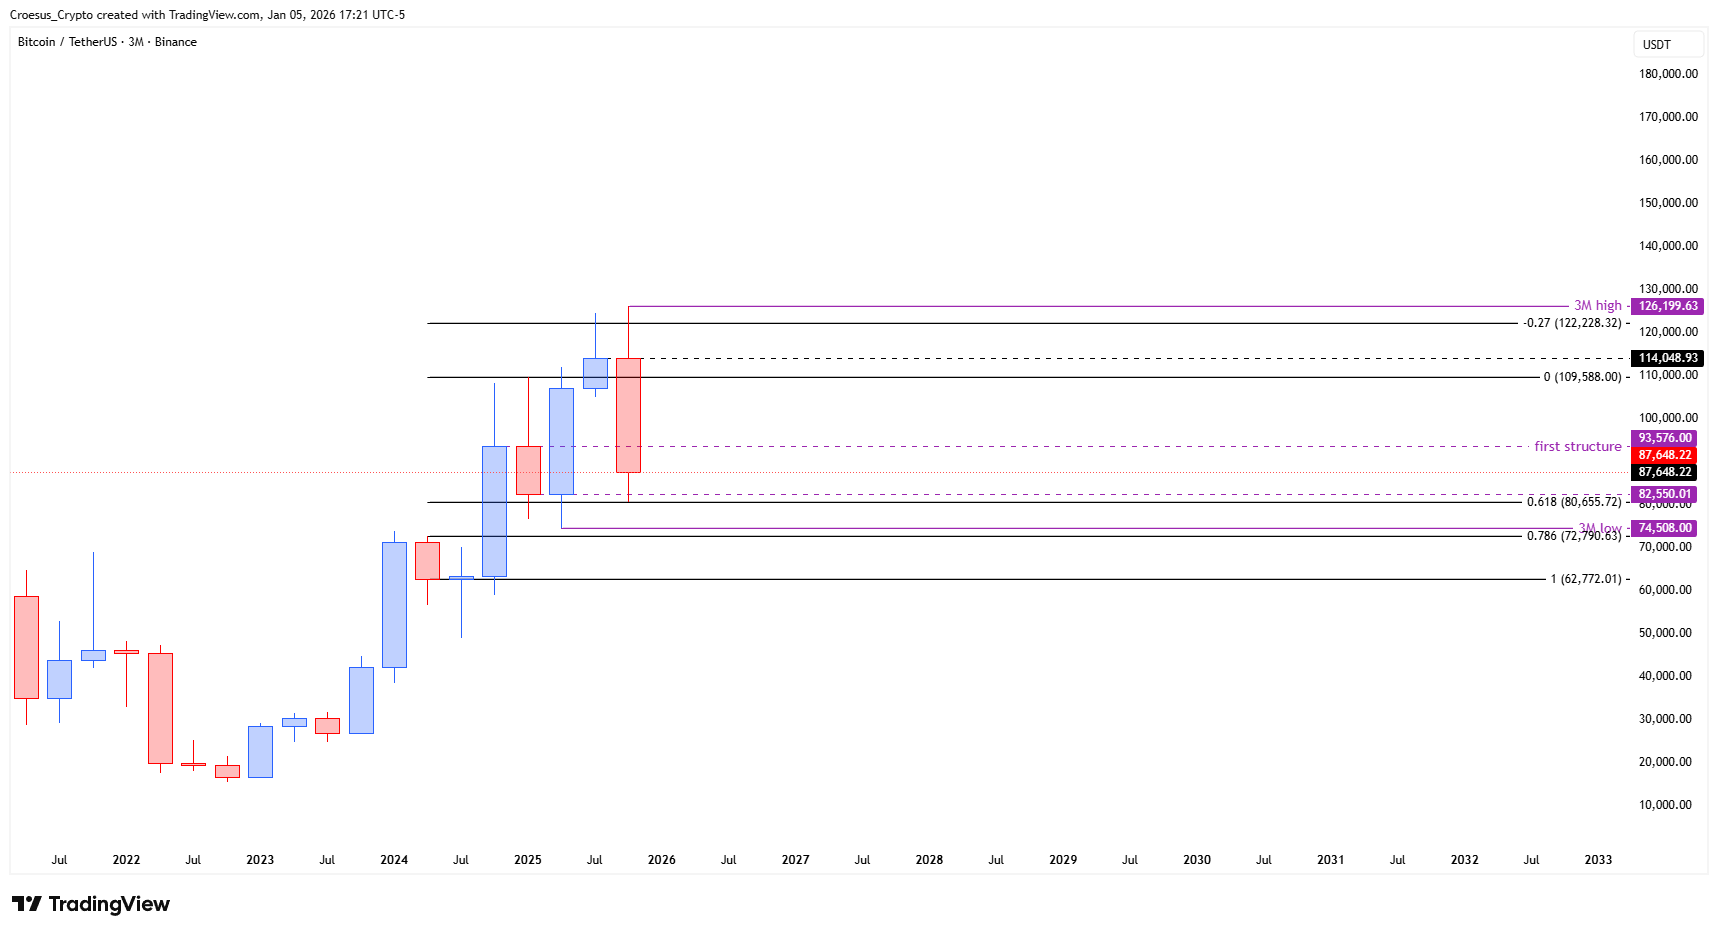
Bitcoin quarterly (3M) chart January 2026 with 3M high, support at 82,550.01, resistance at 93,576.00 and full 100% Fibonacci retracement of the prior impulse.
- as we have a yearly close also we will add the yearly analysis also. At this moment the yearly chart is telling us that we have a large rejection wick/swing failure, indicating us that 2025 was not a positive year for bitcoin.
- The year opened at a significant level : $93.576,00. The first structure is situated at $46.216,93. The low also print a nicely rounded figure : $15.476,00.
- Does this mean that we will go those levels ? No, we could go towards the Y high, even above it, but if we see a close at year's end below the high, it gives us some kind of sentiment that a larger relief rallye is following (on yearly timeframe). We can also see that, if we take the Fibonacci retracement from the prior bullrun, we pierced the -0.27 level in 2024 and retested that level in 2025. Maintaining that level could indicate that we could see some more upside, perhaps structurally revisiting the -0.68 or even wicking towards the -1 level.
- Zooming in the 3M chart (quarterly), we can see that are technically still bullish and made a perfect fib retracement 100% (completely back to the base of the impulse). we can see that the $93.576,00 is also a critical level here as well as on the Y chart.
- Bullish scenario : we experience some resistance at that level but manage to push higher towards the 3M high.
- Bearish scenario : at the $93.576,00 level = first structure price could experience resistance and turn that level into a shoulder level of a larger head and shoulders. During those three months price could easily go higher (look at the wicks of the first candles of this structure), attempting to reach the high but failing at the end.
Market Structure Analysis
On the yearly timeframe, our technical analysis highlights a large rejection wick above the Y high, signalling a swing failure and confirming that 2025 was not a constructive year for trend continuation. Opening the year around 93,576 while closing back below that region builds a narrative of trapped breakout buyers and suggests that any future move above the Y high must be confirmed by a strong close, otherwise it leans toward a larger relief rally on the yearly timeframe rather than a fresh bull leg.
The first structure at 46,216.93 aligns with a major demand zone, with the rounded yearly low at 15,476.00 acting as the extreme of prior capitulation. Using the Fibonacci retracement of the previous bullrun, price pierced and retested the -0.27 extension in 2024–2025; as long as BTC holds that Fibonacci area, upside extension toward the -0.68 and potentially a wick into the -1 zone remains on the table.
On the 3M chart, Bitcoin remains in a bullish context after a clean 100% fib retracement back to the base of the last impulse and a bounce from support around 82,550.01. The overlapping level at 93,576.00 is the key quarterly resistance that also matters on the yearly chart, making it the primary decision point for the next macro swing.
Key Levels and Scenarios
Bullish scenario: if BTC consolidates above 82,550.01 and eventually breaks and closes a quarterly candle above 93,576.00, we expect continuation toward the 3M high and, if momentum persists, toward the higher Fibonacci extensions (-0.68 and -1). That would confirm that the current move is more than just a relief rally.
Critical levels to watch:
Y high area – yearly resistance; yearly close below keeps the “relief rally” narrative in play.
93,576.00 – overlapping yearly open and quarterly resistance / first structure; breakout or rejection zone.
82,550.01 – current quarterly support where price recently found bids.
46,216.93 – first structure on the yearly chart; major downside target if quarterly support fails.
15,476.00 – rounded yearly low; only in play if market enters a deep corrective phase.
Trading Implications
From a trading perspective, the asymmetric area is currently between 82,550.01 (support) and 93,576.00 (resistance): aggressive bulls may look for continuation setups above support with tight invalidation below, while conservative traders might wait for a clear breakout and close above 93,576.00 to avoid getting trapped in a potential right shoulder of a larger head-and-shoulders pattern.
This analysis is for educational purposes only and is not financial advice; always do your own research and manage your risk accordingly.