


In this TOTAL daily analysis for early December 2025, we focus on the competing bullish and bearish structures forming around the recent rejection at the daily high. Our technical analysis remains aligned with the Croesus “naked chart” methodology, emphasizing clean support resistance zones and structure.
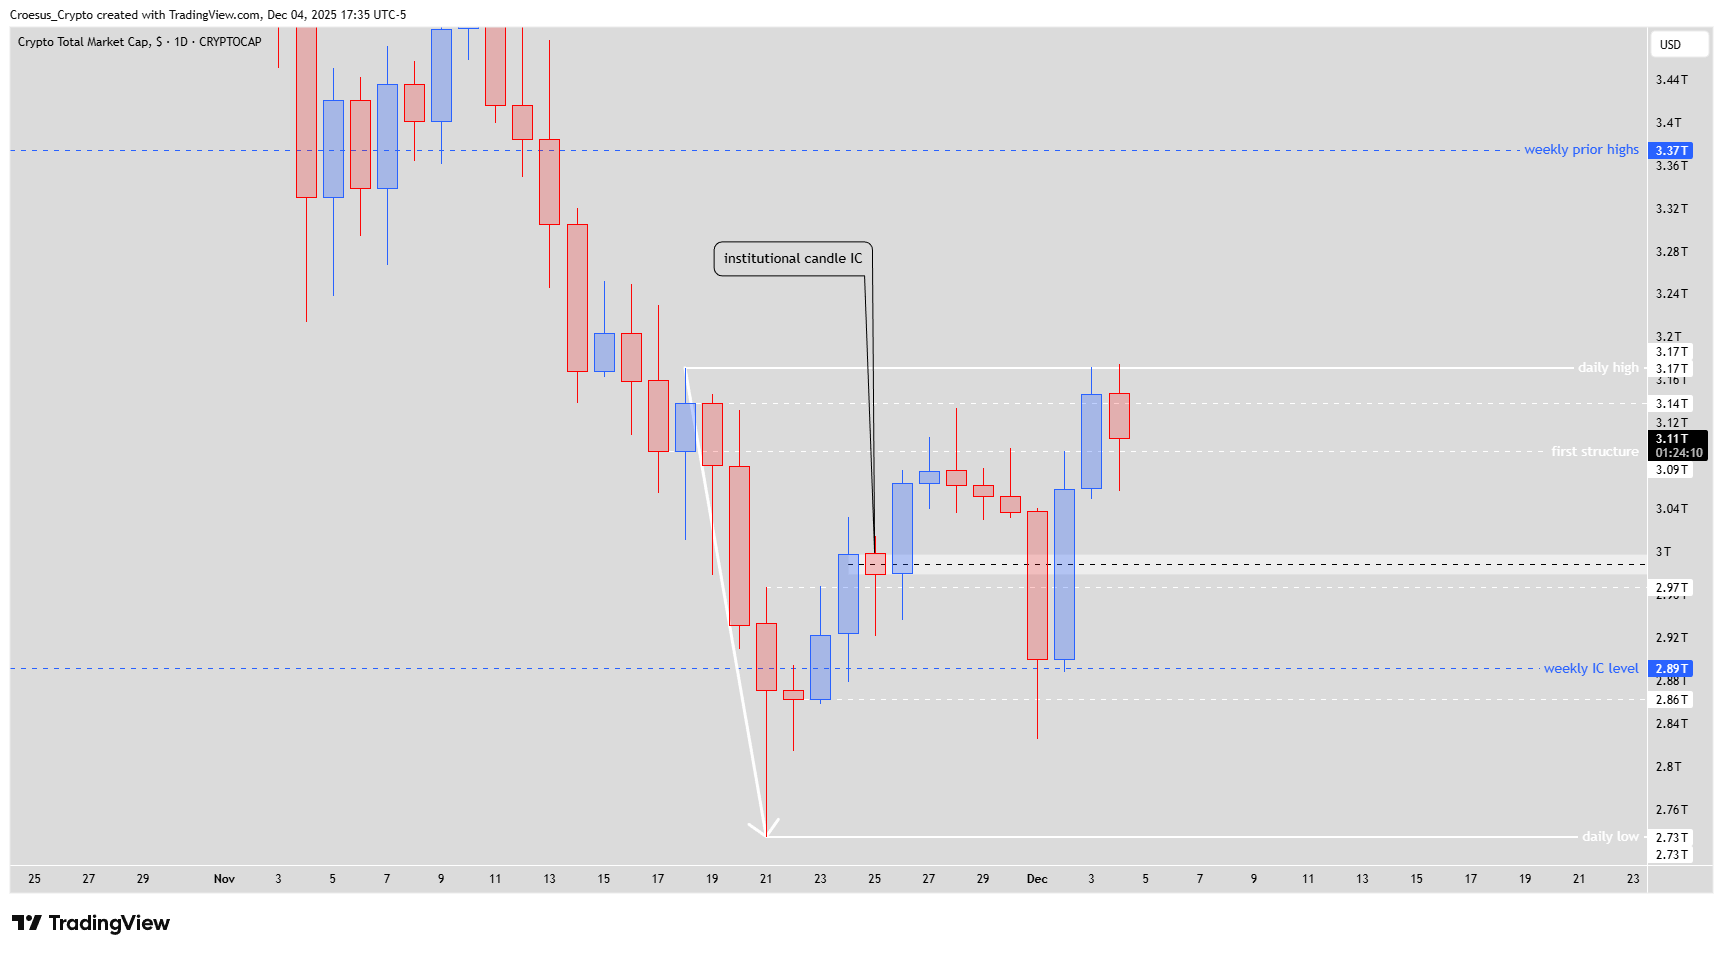
TOTAL daily chart close-up 4 Dec 2025 highlighting institutional candle IC, daily high and first structure zone.
Trend = bearish
Technical Analysis Key Points
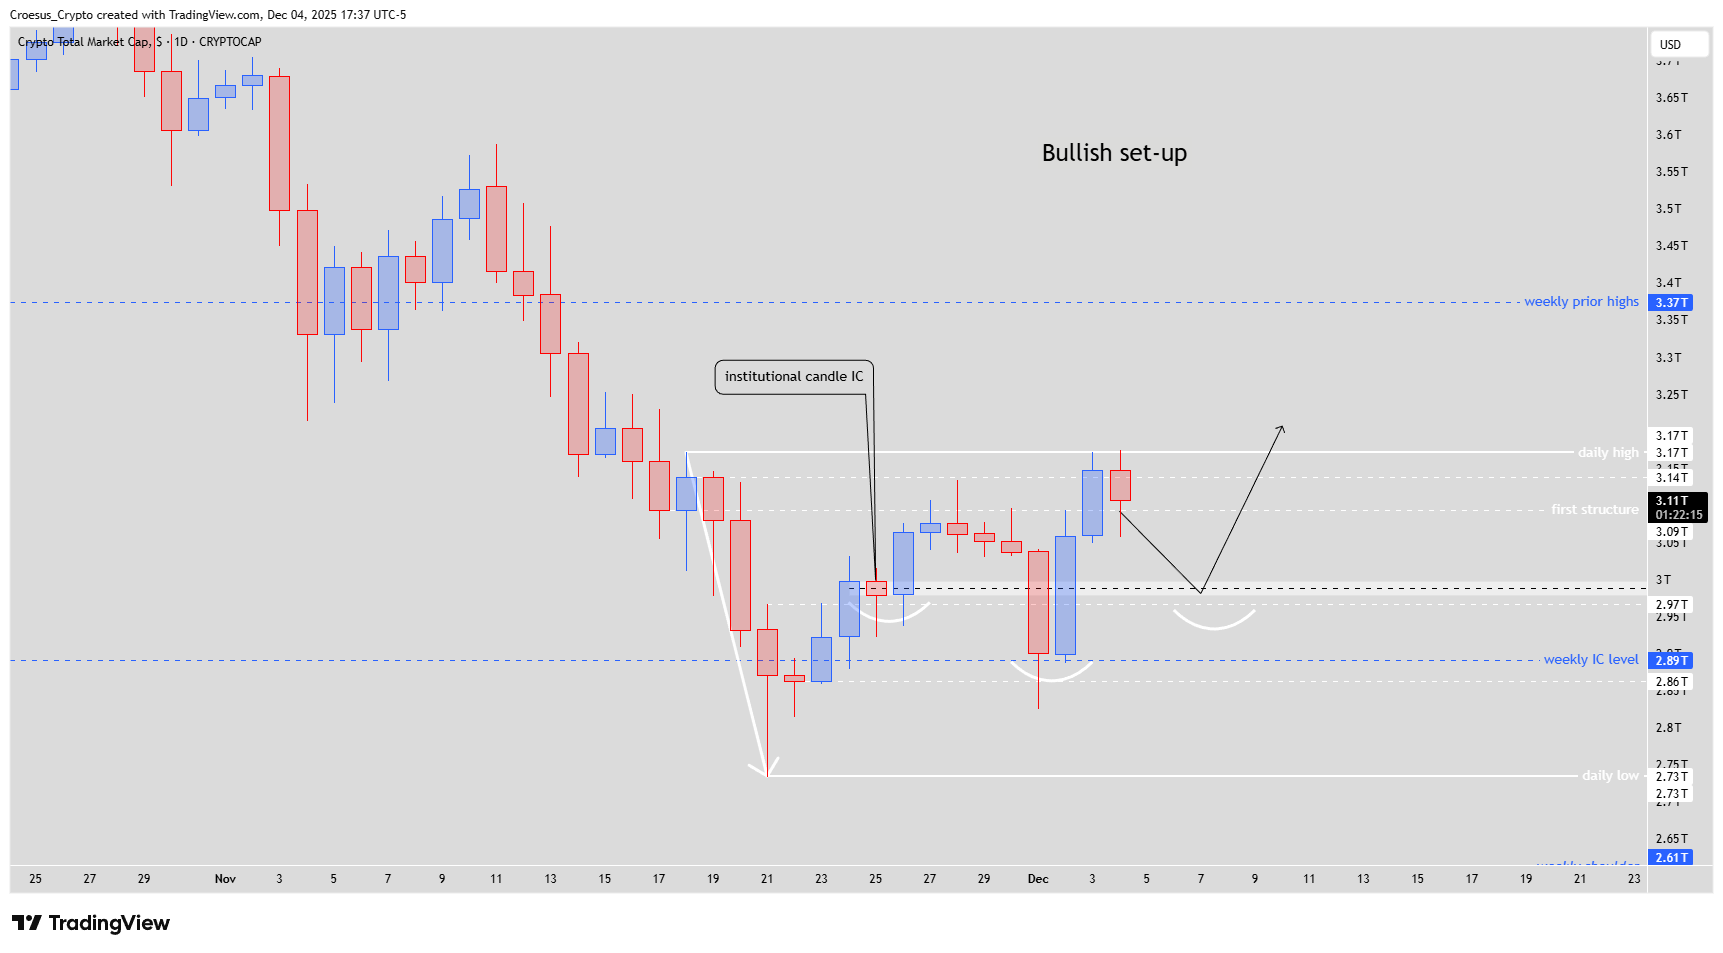
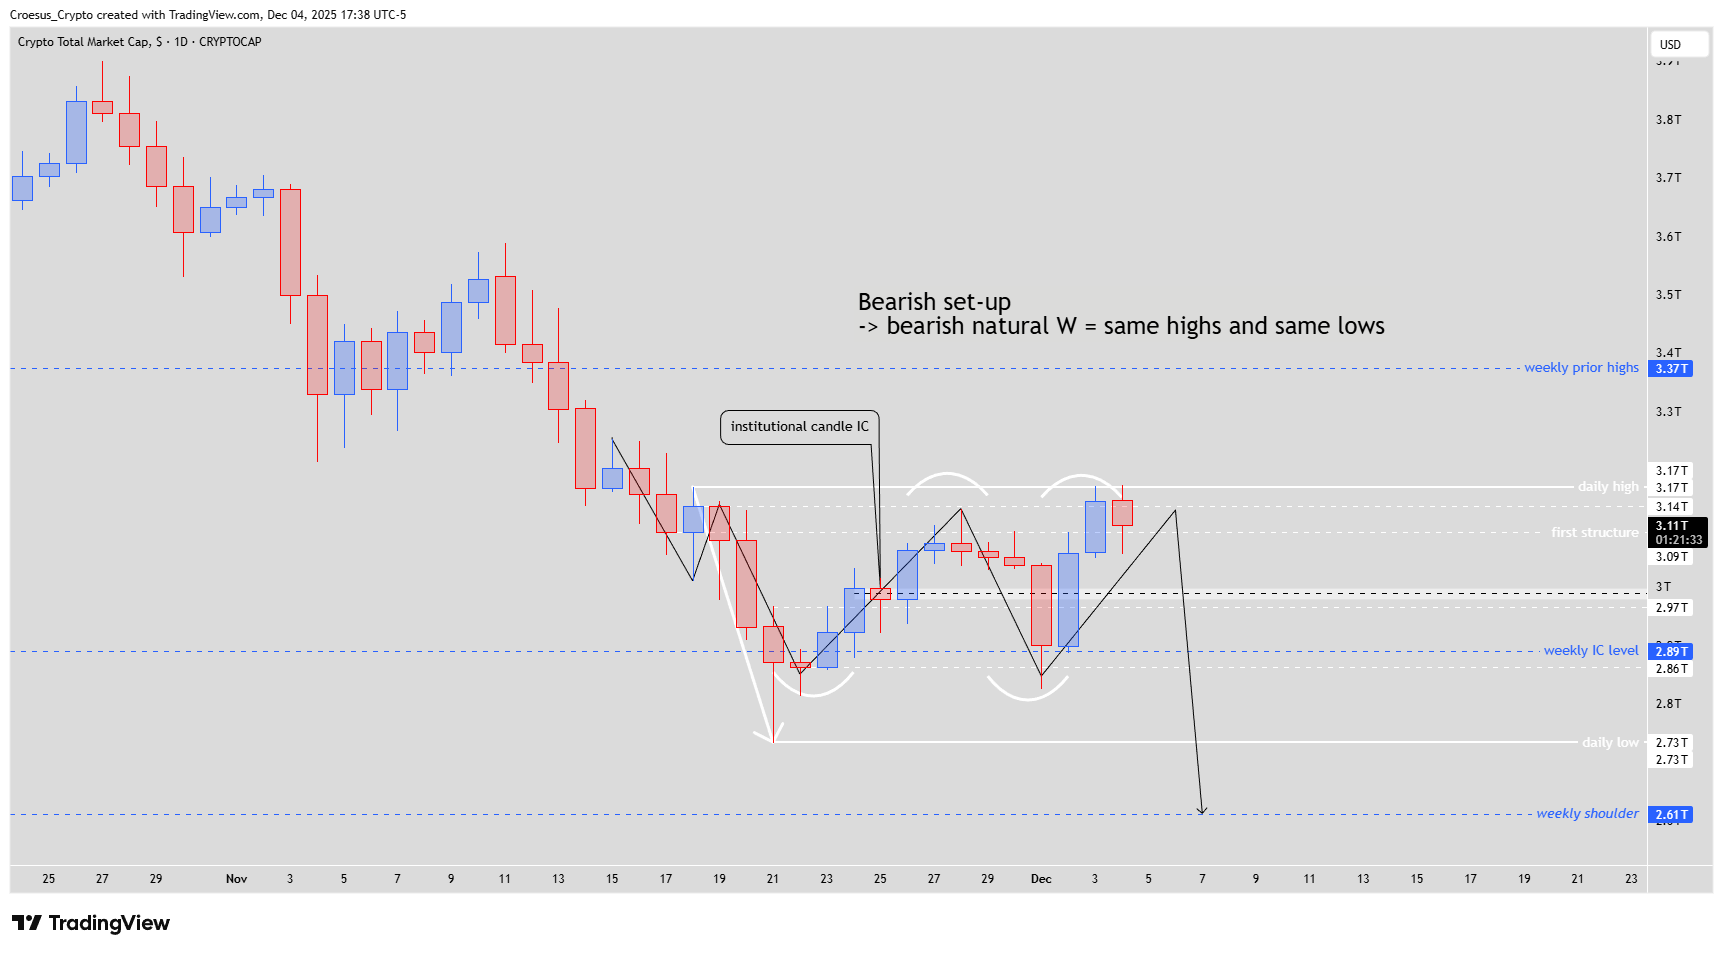
- After touching the daily high yesterday, we saw the index retest the high again, followed by a rejection. Both set-ups remain valid. If we see a slow correction towards the IC-zone, the bullish set-up is in favor.
- Bullish = switch of momentum + if the IC-zone holds as strong support zone for a bullish reversal, printing a inverse head and shoulder.
- Bearish = even with a strong momentum, bulls are not able to break the daily entry zone. If we see a reversal, this a typical set-up for a bearish natural W, where, after printing the bearish W, the index printed equal lows and equal highs. This only confirms the strength of the first bearish W.
Market Structure Analysis
Our TOTAL daily analysis shows price rejecting the daily high for a second time, confirming it as short-term resistance. The IC-zone around the institutional candle remains the key pivot: hold it, and the inverse head and shoulder scenario gains traction; lose it, and the previously formed bearish natural W reasserts control. Equal highs and equal lows around that W structure highlight a balanced but fragile range, typical before a decisive break. While no explicit Fibonacci levels are drawn, traders may overlay Fibonacci retracements on the prior impulse to refine confluence inside the IC-zone and near the daily entry zone.
Key Levels and Scenarios
Bullish scenario: A slow, controlled pullback into the IC-zone that holds as support, followed by a clear momentum switch and neckline break of the inverse H&S, opens room back toward and beyond the daily high.
Key levels to watch:
Daily high: Repeated rejection; main resistance and decision point.
Daily entry zone: Failure to break keeps bearish structure in play.
IC-zone (institutional candle): Critical support for bullish reversal.
Weekly IC level: Deeper support if IC-zone gives way.
Weekly shoulder low: Invalidates bullish case if clearly broken.
Trading Implications
For active traders, the IC-zone is the key battleground: conservative longs look for reversal confirmation there with tight stops below the zone, while bears wait for rejection at the daily entry/daily high area, targeting a move back toward weekly support; position sizing should reflect the binary nature of this setup and respect predefined risk limits.
This analysis is for educational purposes only and does not constitute financial advice.