


In this ETH daily analysis for December 2025, we see clear confirmation that sellers remain in control after repeated failures at the daily entry zone. Our analysis focuses on how far any corrective bounce can extend before the broader bearish structure resumes and where key support resistance levels lie.
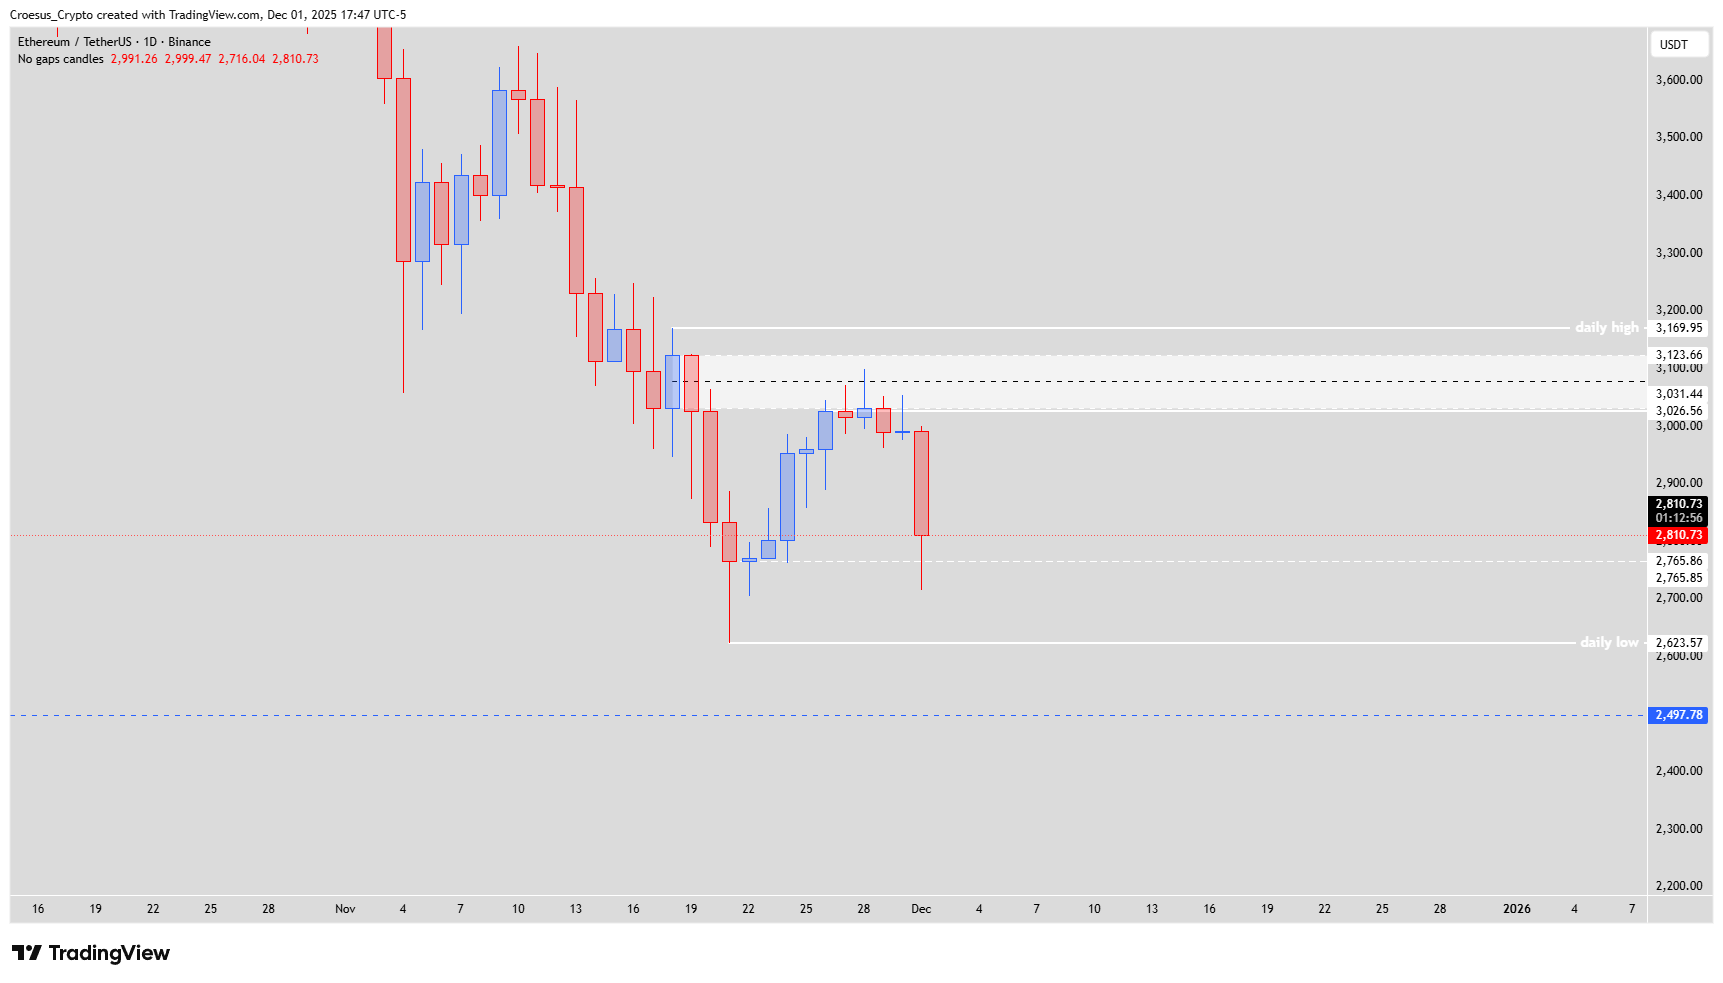
Ethereum daily chart 01 Dec 2025 showing broader downtrend, daily low around 2,623.57 and deeper extension near 2,497.78.
Trend = bearish ↓
Technical Analysis Key Points
- After 5 clear daily rejection of the daily entry zone, price today showed us a very impulsive sell-off, showing us that bears are still in power and outpower the bulls strongly at this moment
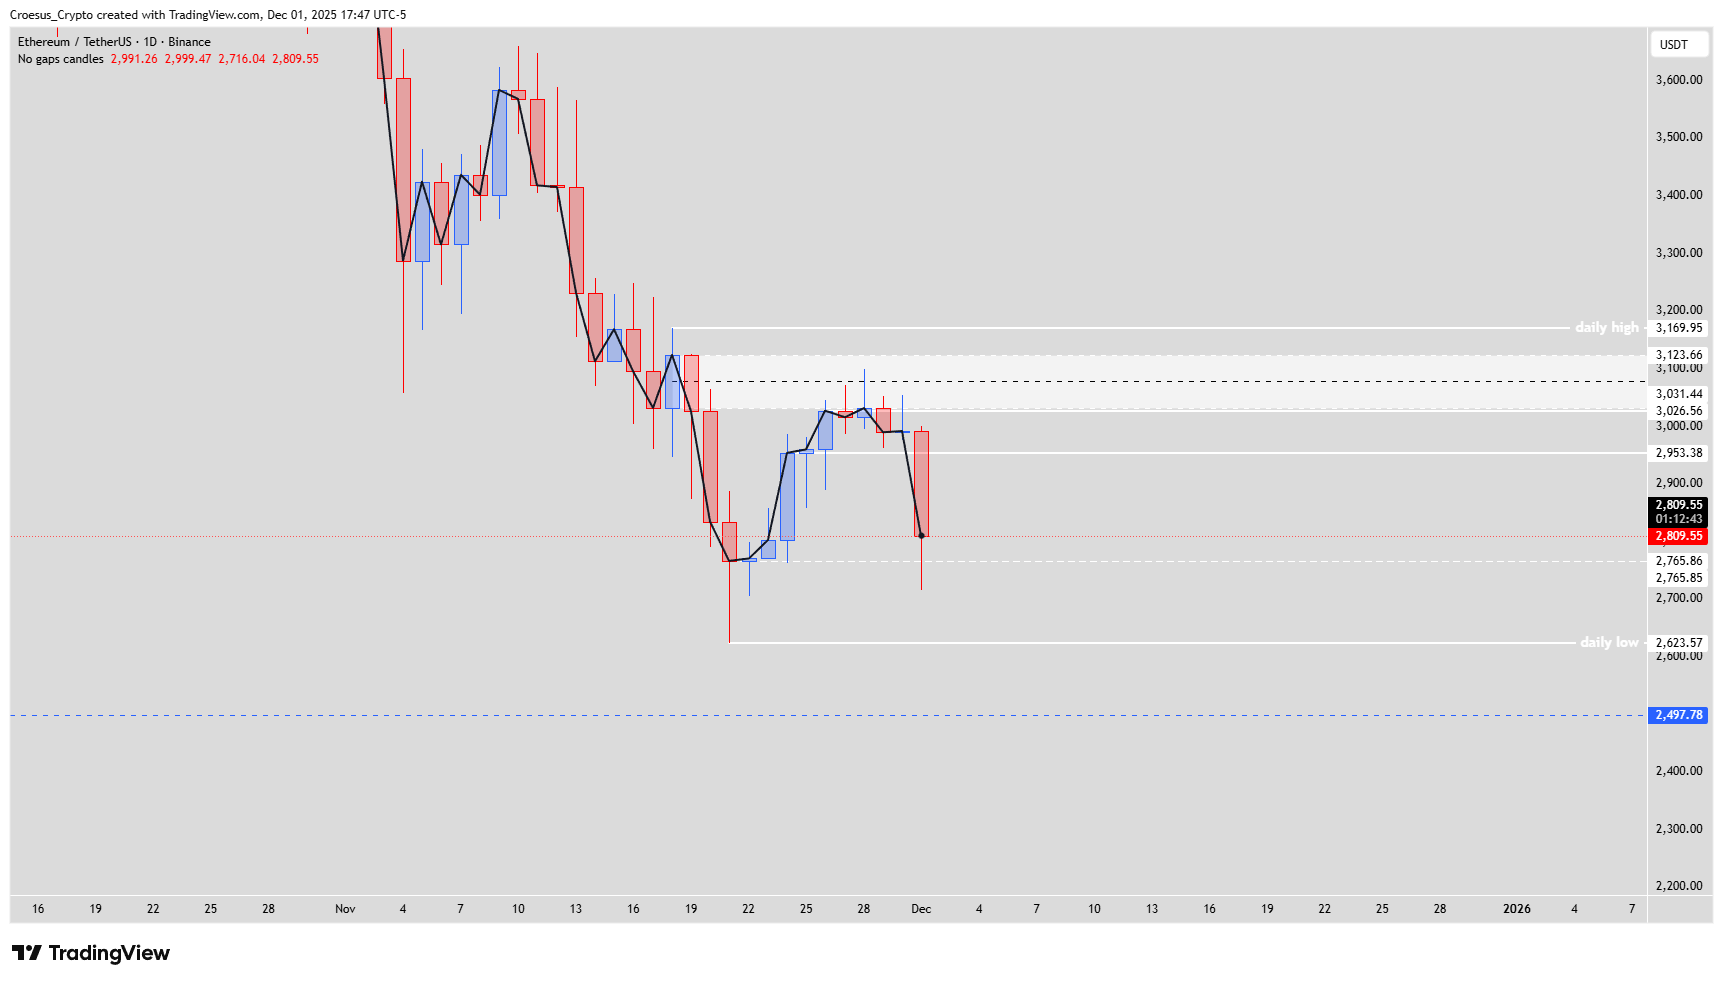
- After such an impulse, price often makes a correction. We could see a complete correction of the bearish candle, as we can see a structure at 2,953.38 $, giving us the first structure (you will an experienced eye to notice this structure. The easiest way is to put on the line chart, there it is clearly visible)
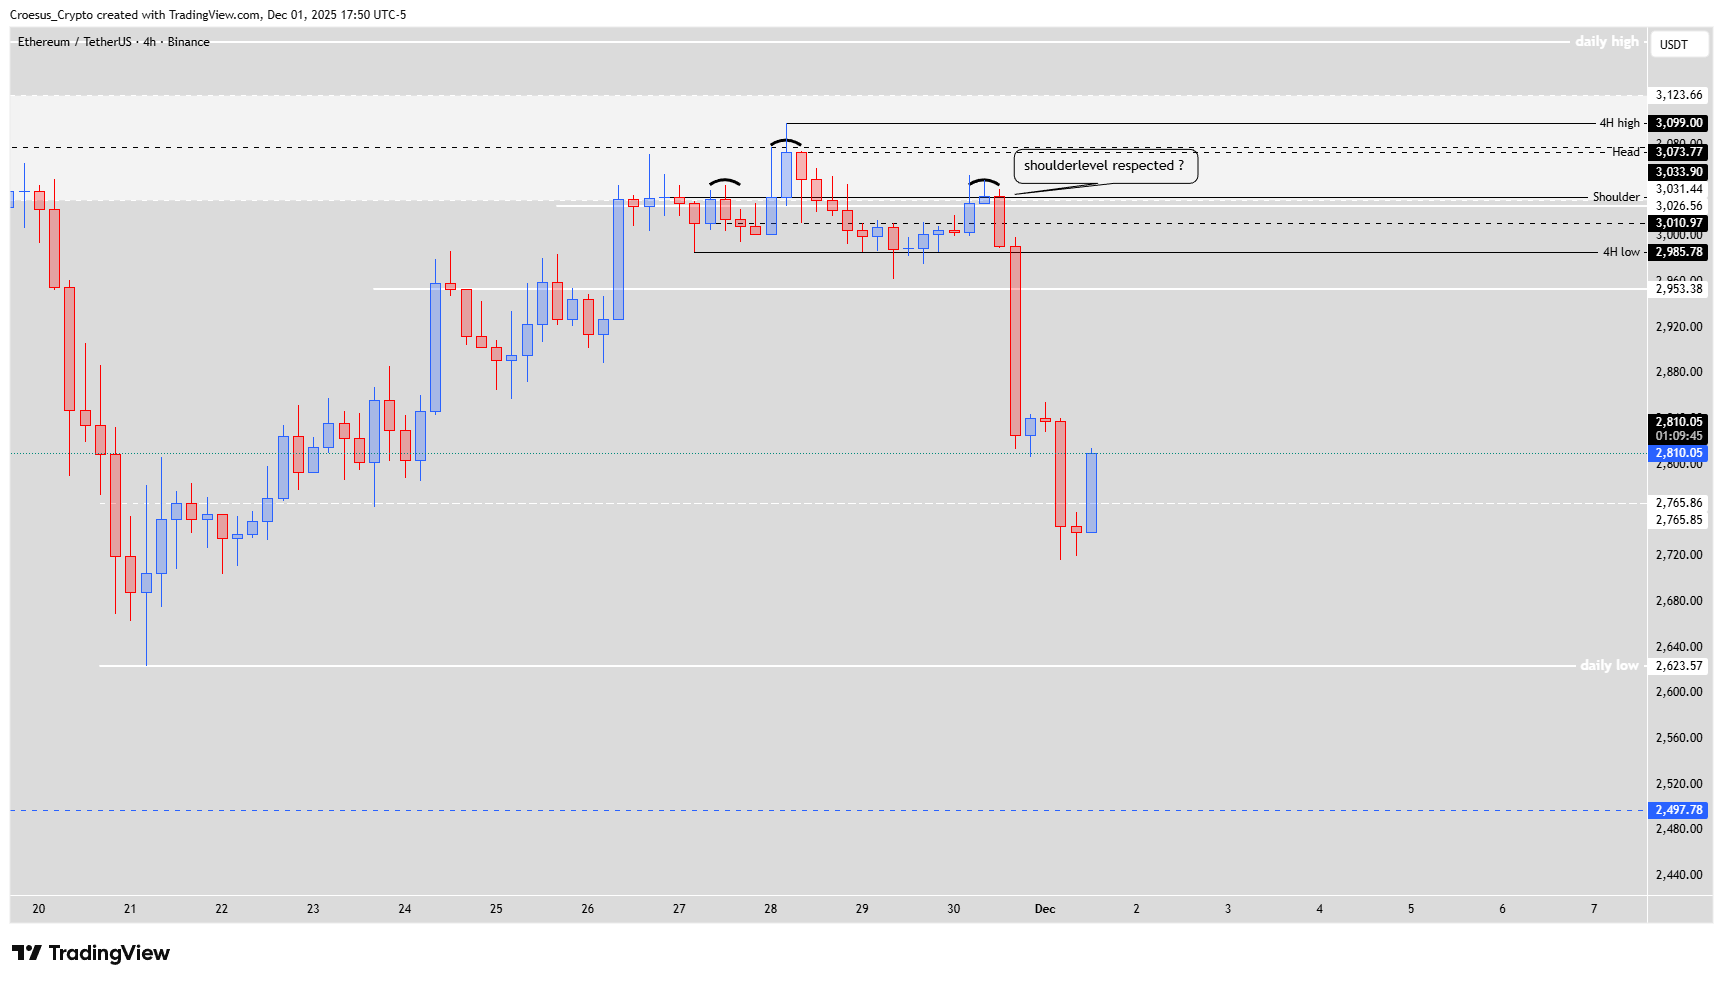
- On the 4H chart we can see that the head and shoulder pattern played out nicely. With one reservation, with the printing of the shoulder 2, the shoulder level wasn't respected. Therefore it keep the possibility open that we can see a retrace towards the shoulder 2 level, this time respecting it.
Market Structure Analysis
This ETH daily analysis shows five consecutive rejections of the same daily entry zone around 3,000–3,100, confirming a strong supply area. The latest candle is a powerful bearish impulse that breaks short-term higher lows and shifts market structure back in favor of sellers. From a technical analysis standpoint, we now expect any move up to be corrective.
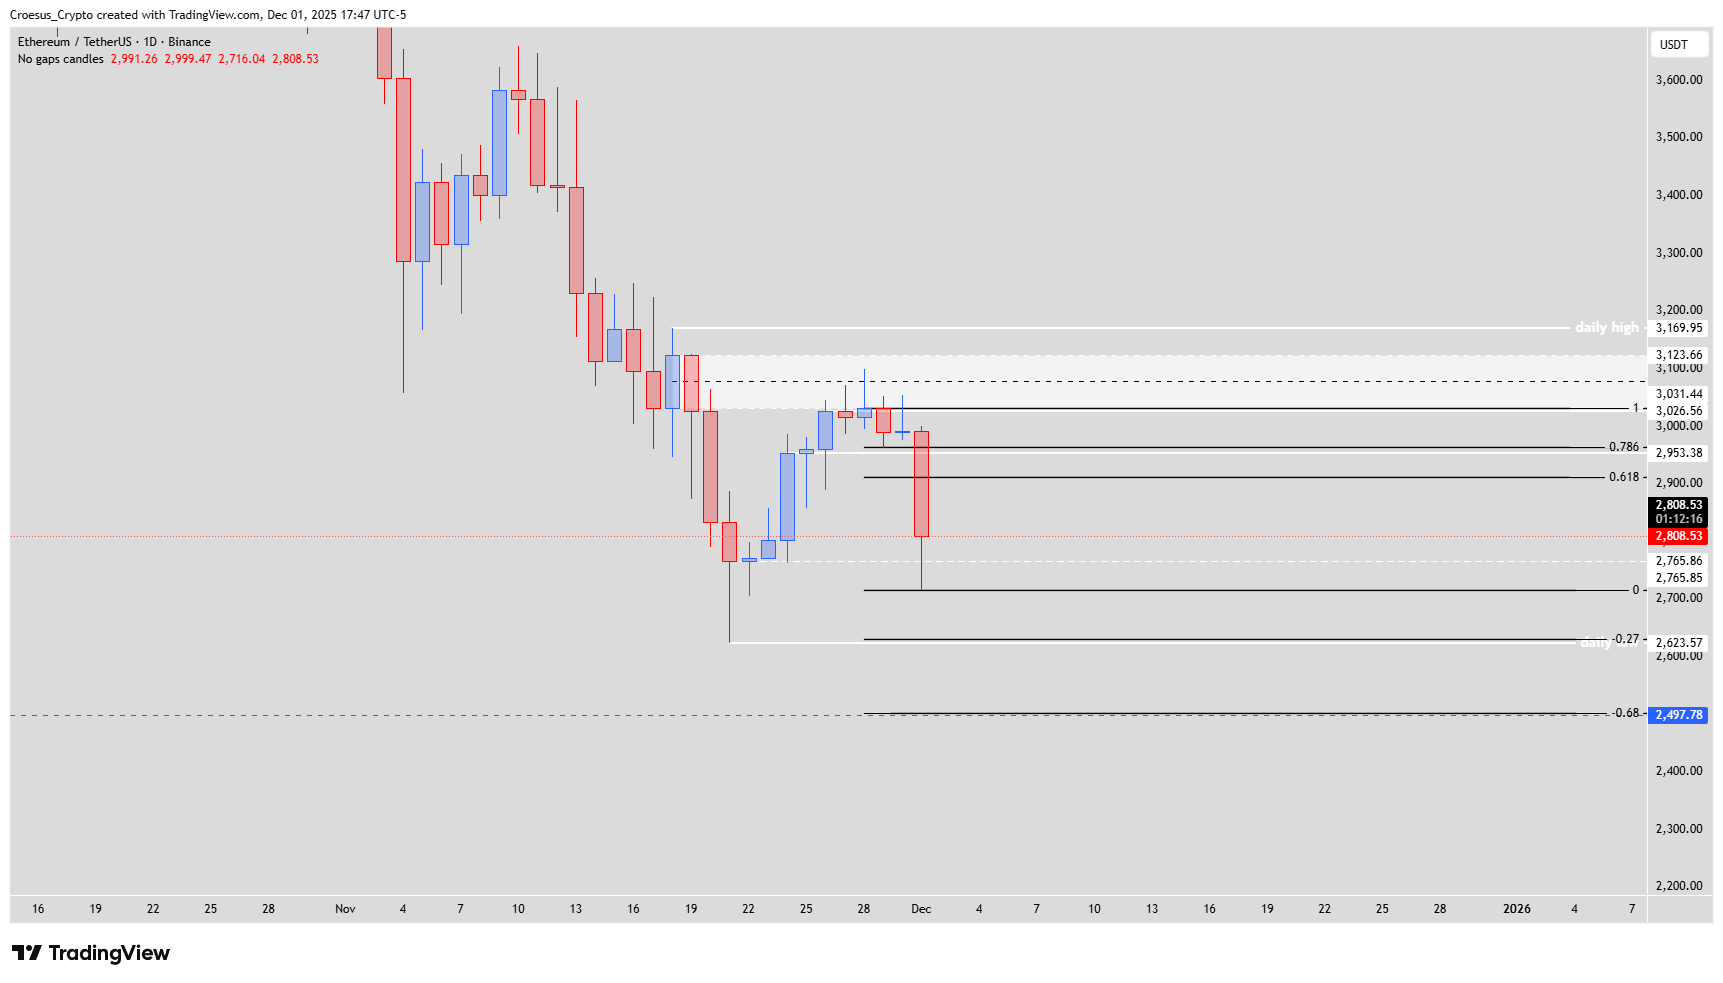
The first meaningful structure sits near 2,953.38, which also aligns closely with a key Fibonacci retracement from the recent swing. A controlled bounce into that level would be our initial resistance to watch; acceptance above could open the door for a deeper retrace toward the 4H shoulder 2 zone, where a new lower high could form. On the downside, the daily low area around 2,623.57 and the extension toward 2,497.78 represent the next liquidity pools if selling pressure resumes.
Key Levels and Scenarios
3,000–3,100 daily entry zone: Strong resistance after five rejections.
2,953.38 first structure: Primary corrective target and potential short re-entry if rejected.
Shoulder 2 zone (~3,02x–3,03x): If price revisits and respects this level, it would complete a cleaner head and shoulder pattern.
2,623.57 daily low: Important downside level if current support fails.
2,497.78 extension: Deeper support / extension area should the trend accelerate lower.
Trading Implications
For traders, waiting for a slow, corrective move into 2,953.38 or even the shoulder 2 zone offers defined invalidation and better risk/reward than chasing the initial dump.
This publication is for educational purposes only and does not constitute financial advice or a recommendation to buy or sell any asset.