


ETH Marketcap / Ethereum
ETH Daily analysis 02 February 2026. Ethereum is trading in a clear bearish environment after an impulsive continuation leg, while early signs of a short-term relief attempt start to print on the chart.
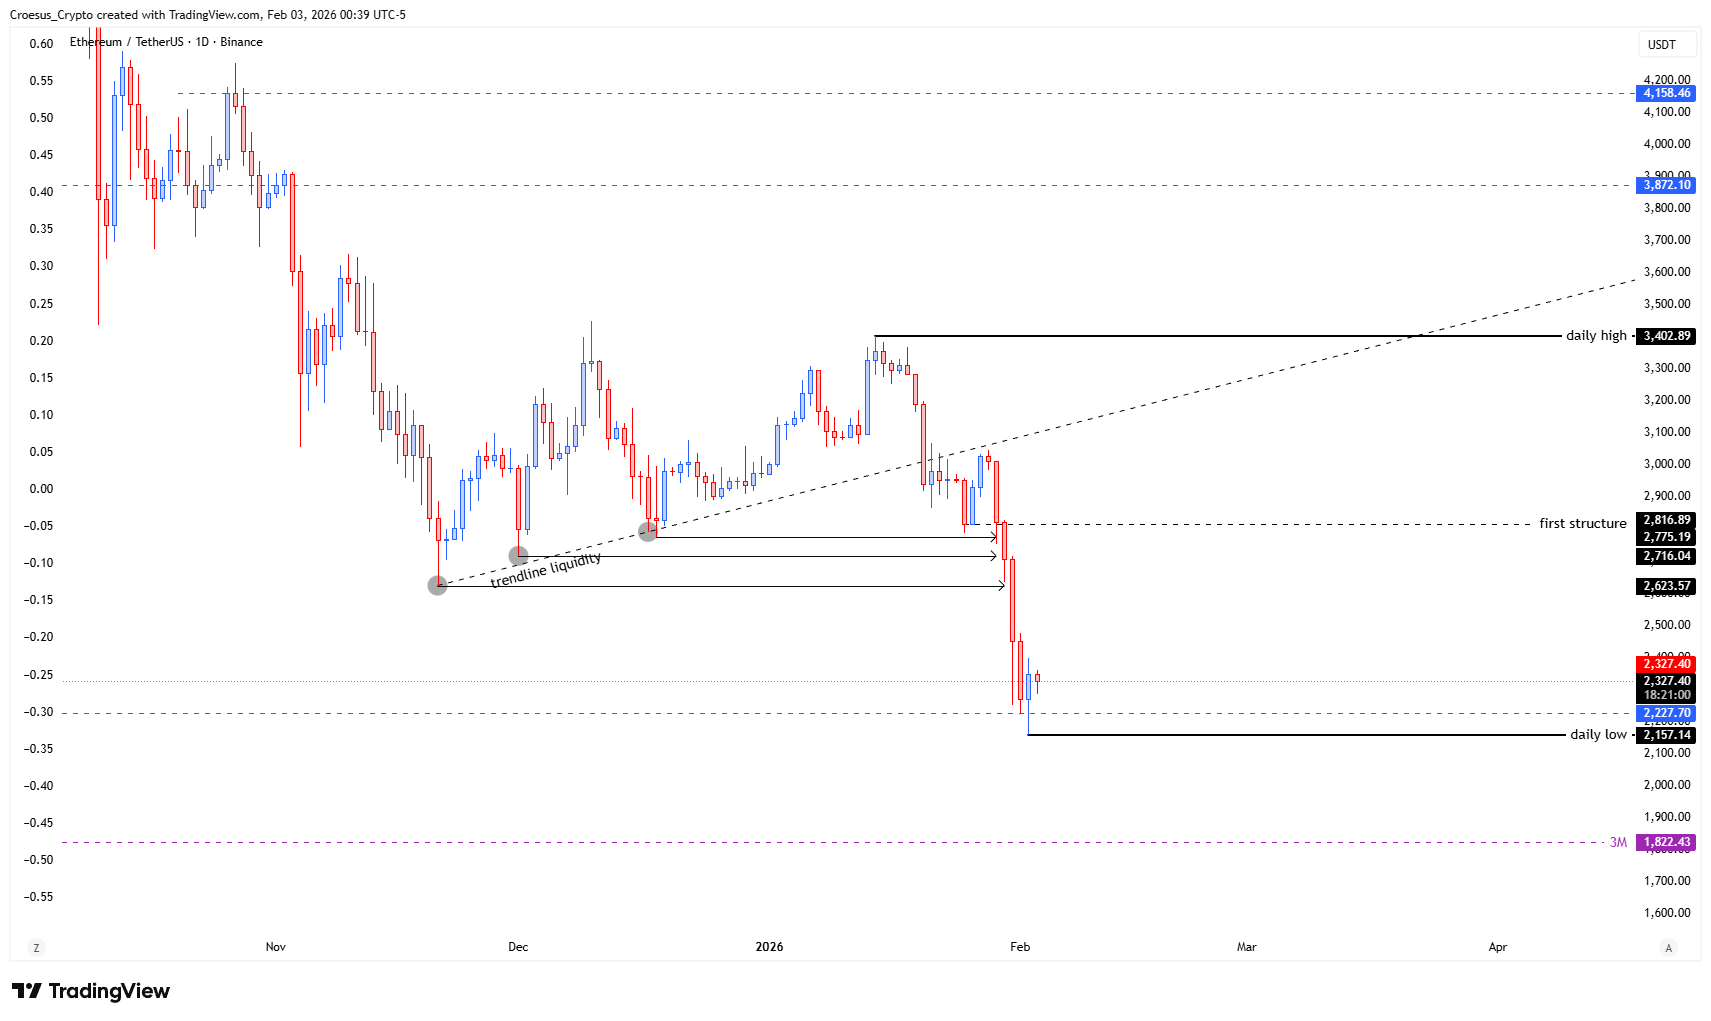
- The price made a strong bearish continuation, sweeping all the liquidity levels
- Now we can see a first bullish candle being printed, indicating a potential relief
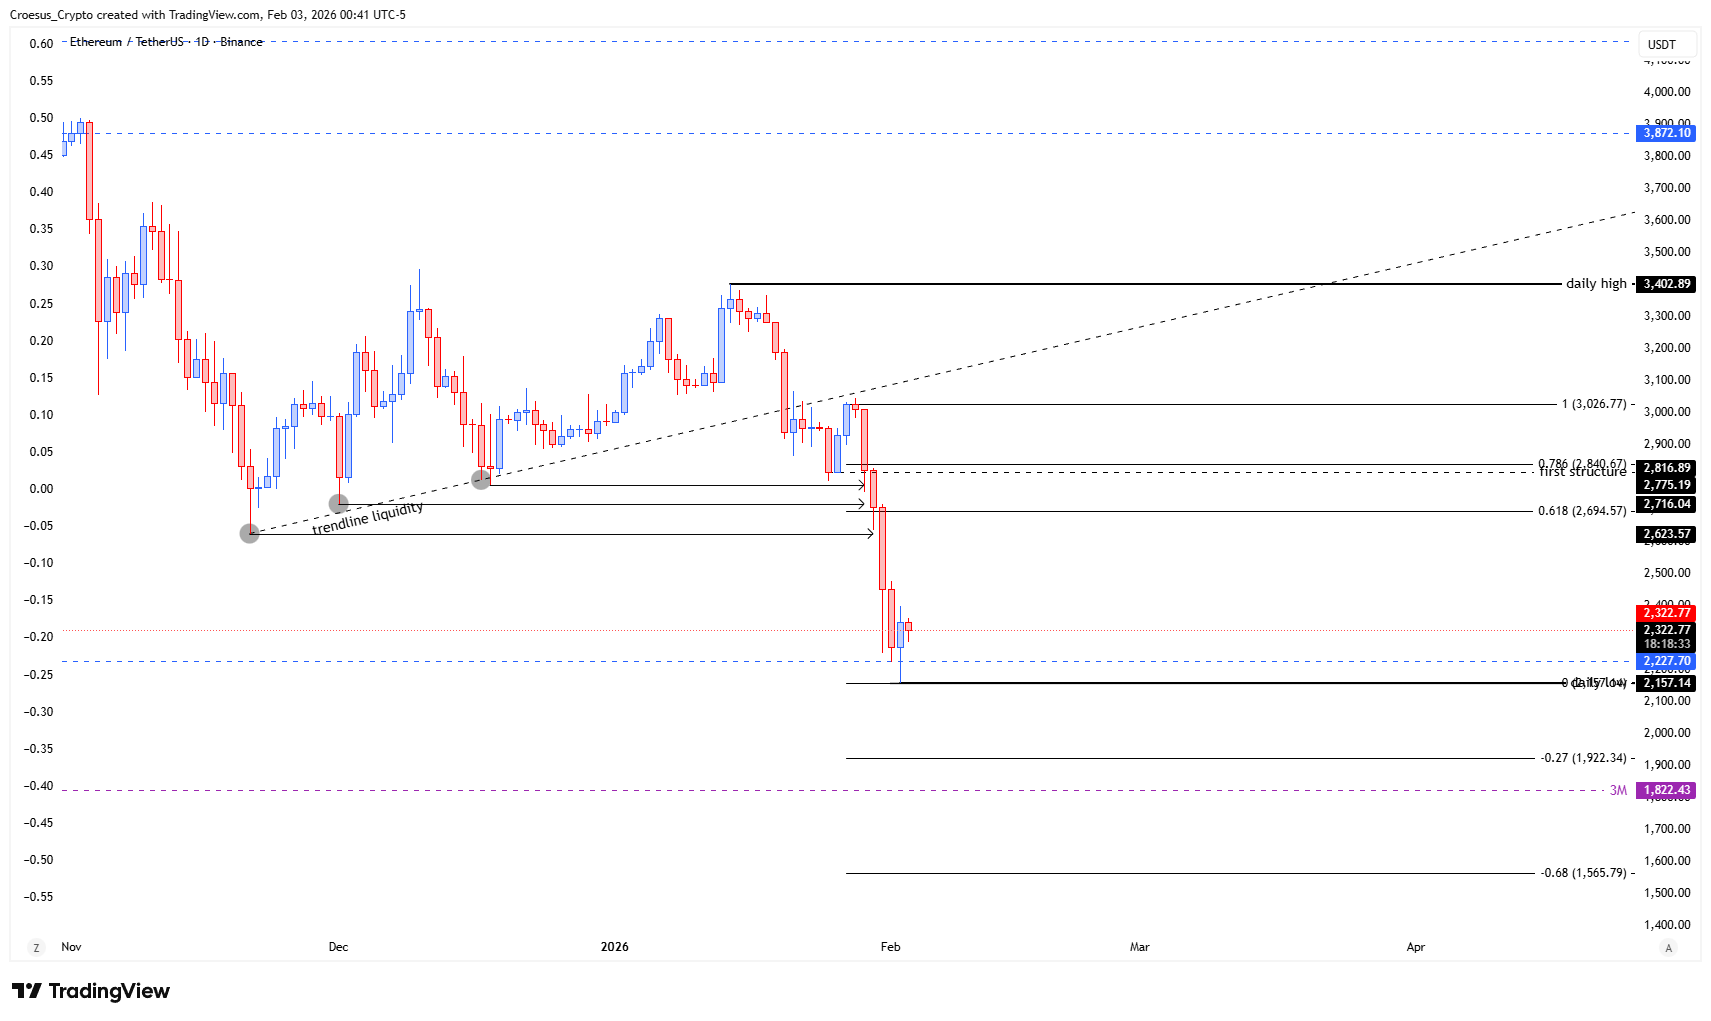
- If we pull the Fib retracement of the last bearish impulse, we can see the confluence of the fib 0.786 level with the daily first structure, indicating us that this level could be a potential target of the relief rally
- Nevertheless the potential bullish activity we might expect, it remains a countertrend move. We are still in a bearish trend, until proven otherwise. We can still a further bearish continuation after the relief.
Market Structure Analysis
Our ETH daily analysis focuses on the latest bearish impulse that swept multiple liquidity pools, which typically reflects forced exits and stop runs around prior swing references. Structurally, that kind of expansion move often transitions into a corrective structure where price mean-reverts back toward nearby resistance. The first bullish candle now printing is an early signal of demand responding after the sweep, but it does not yet change market structure. With the Fibonacci retracement applied to the last bearish impulse, the 0.786 level aligning with the “daily first structure” creates a clear support resistance confluence that can act as a magnet for a relief rally. Until ETH reclaims and holds key structure, the dominant read remains bearish, with any bounce treated as corrective within the broader downtrend.
Key Levels and Scenarios
Bullishly, continuation of the relief depends on sustained follow-through from the first bullish candle and acceptance back into prior structure, with the Fib 0.786 confluence as the primary corrective target zone. Bearishly, failure to reclaim structure keeps ETH positioned for another impulsive leg lower after the relief, consistent with the prevailing trend in this ETH daily analysis.
- The liquidity sweep low: key reference for whether sellers remain in control
- Fib 0.786 retracement: corrective target zone for a relief rally
- Daily first structure: confluence resistance/support pivot where reaction matters
- Last bearish impulse range: defines whether the move is corrective or a reversal attempt
Trading Implications
In a bearish trend, countertrend relief rallies can be sharp but fragile. Aggressive participants typically treat the move as a short-term corrective opportunity, while conservative participants usually wait for a break of structure and a clean retest before considering any trend shift. Risk remains elevated while ETH is still reacting inside the prior bearish impulse.
This analysis is for informational purposes only and does not constitute financial advice.