


ETH Marketcap / Ethereum
ETH daily analysis 02/04/2026. Ethereum is trading in a bearish corrective phase, with price action focusing on a retest zone that could decide whether sellers stay in control or whether a base starts forming.
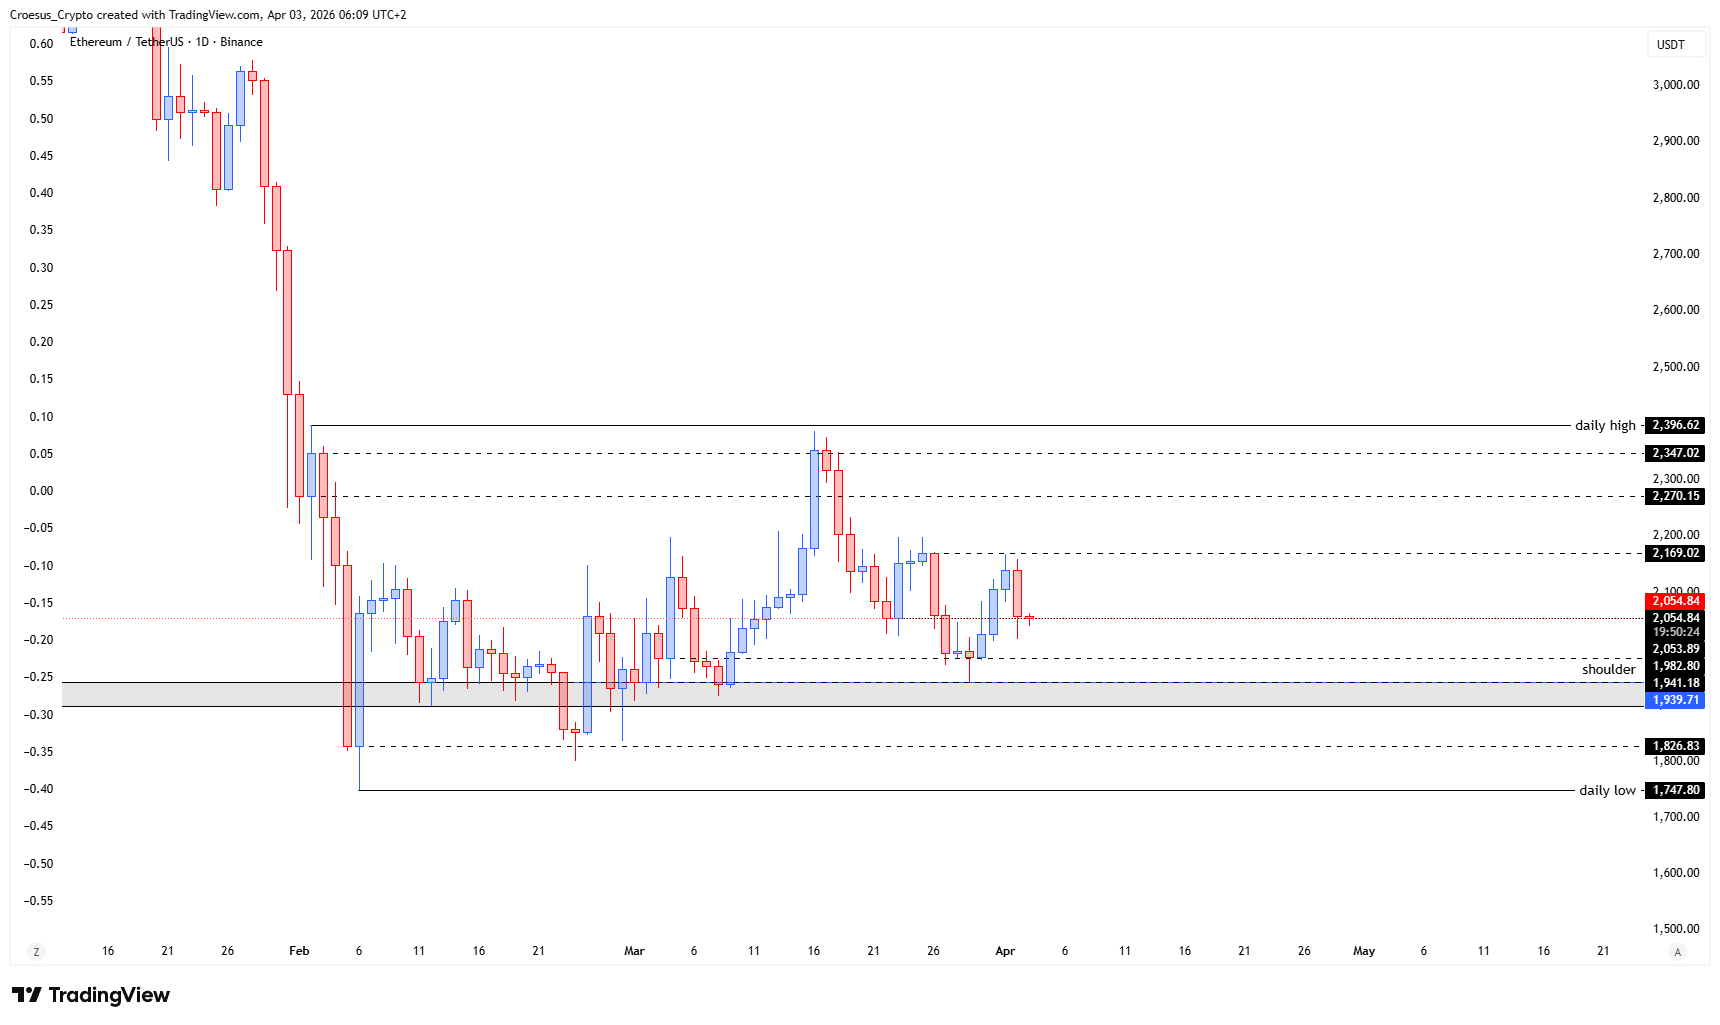
- The ETH price shows us a retest of a prior low, creating possibly an inverse head and shoulders pattern upon the shoulderlevel.
- Eventhough the retest wasn't as deep as TOTAL and BTC, same question here : does the shoulderlevel hold as support ?
Market Structure Analysis
In our ETH daily analysis, the key structural element is the retest of a prior low inside a broader bearish context. A clean retest often acts as a “decision point” where liquidity is tested and the market reveals whether demand is willing to defend a level. The mention of a possible inverse head and shoulders around the shoulderlevel matters because it frames the move as a corrective structure that can transition into a reversal attempt if support consistently holds and price starts printing higher lows. If the shoulderlevel is defended, it signals absorption of sell pressure at a known horizontal level and keeps the basing narrative intact. If that support fails, the structure reads as continuation of the bearish leg, with the retest turning into a breakdown and expanding downside risk.
Key Levels and Scenarios
The bearish scenario remains active while ETH cannot reclaim structure above the current corrective zone. The bullish alternative requires the market to hold the shoulderlevel as support and build a clear higher-low sequence from this retest area, turning the current correction into a potential reversal base.
- Prior low retest zone: the current inflection area where liquidity has been tested
- Shoulderlevel: primary support that must hold to keep the possible inverse head and shoulders valid
- Overhead horizontal resistance: the first area to reclaim to shift market structure away from bearish control
Trading Implications
For traders using naked technical analysis, this is a high-signal area but also a higher-risk one: aggressive positioning typically depends on immediate support confirmation, while conservative approaches usually wait for a clearer break of structure and support resistance flip. Until that confirmation appears, our ETH daily analysis stays focused on whether this retest produces a stable base or a continuation breakdown.
This analysis is for informational purposes only and does not constitute financial advice.