


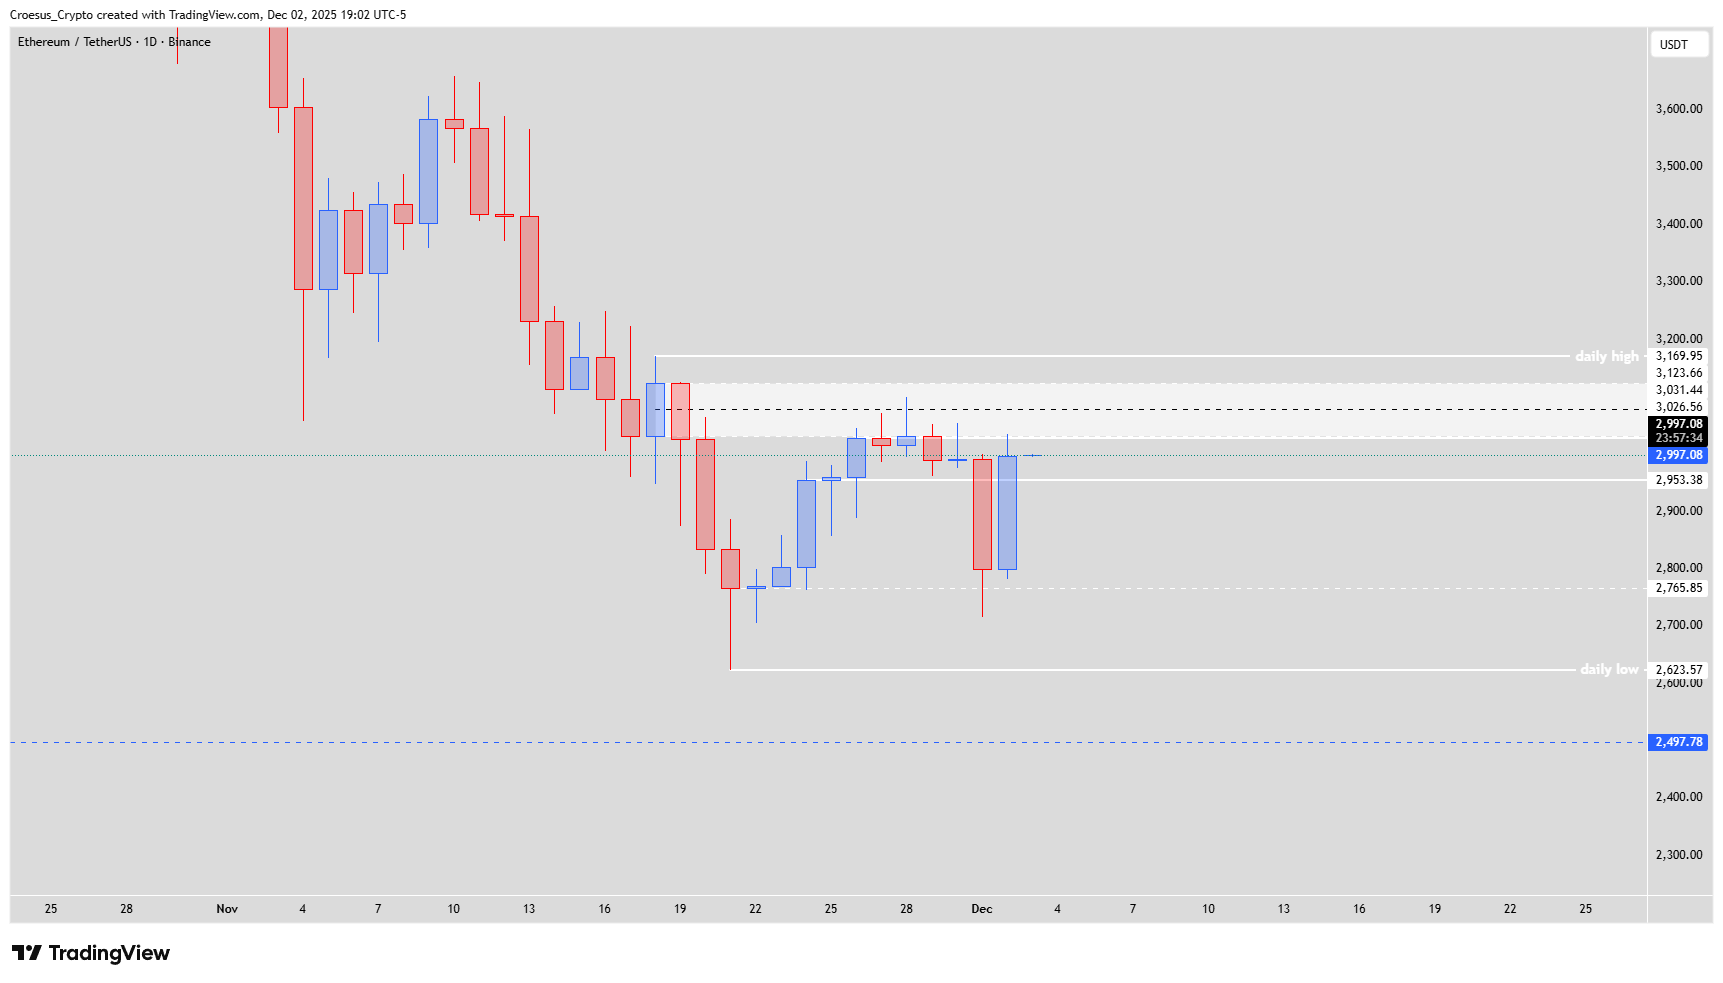
In this Ethereum daily analysis for December 2025 we see ETH reacting strongly after tapping a key daily liquidity zone. Yesterday’s wick into liquidity was followed today by a decisive bullish candle that erased several prior red candles and shifted short-term momentum, even though the broader trend on the daily timeframe remains bearish. Our technical analysis therefore focuses on how price behaves between the shoulder level around $2.959,36 and the unbroken daily high that still acts as clear resistance in this support resistance range.
Ethereum daily chart Dec 2025 neutral view with daily liquidity and local range.
Trend = bearish ↓
Technical Analysis Key Points
- Yesterday the price hit the daily liquidity, followed today by a very impulsive bullish reaction, showing us a switch of momentum.
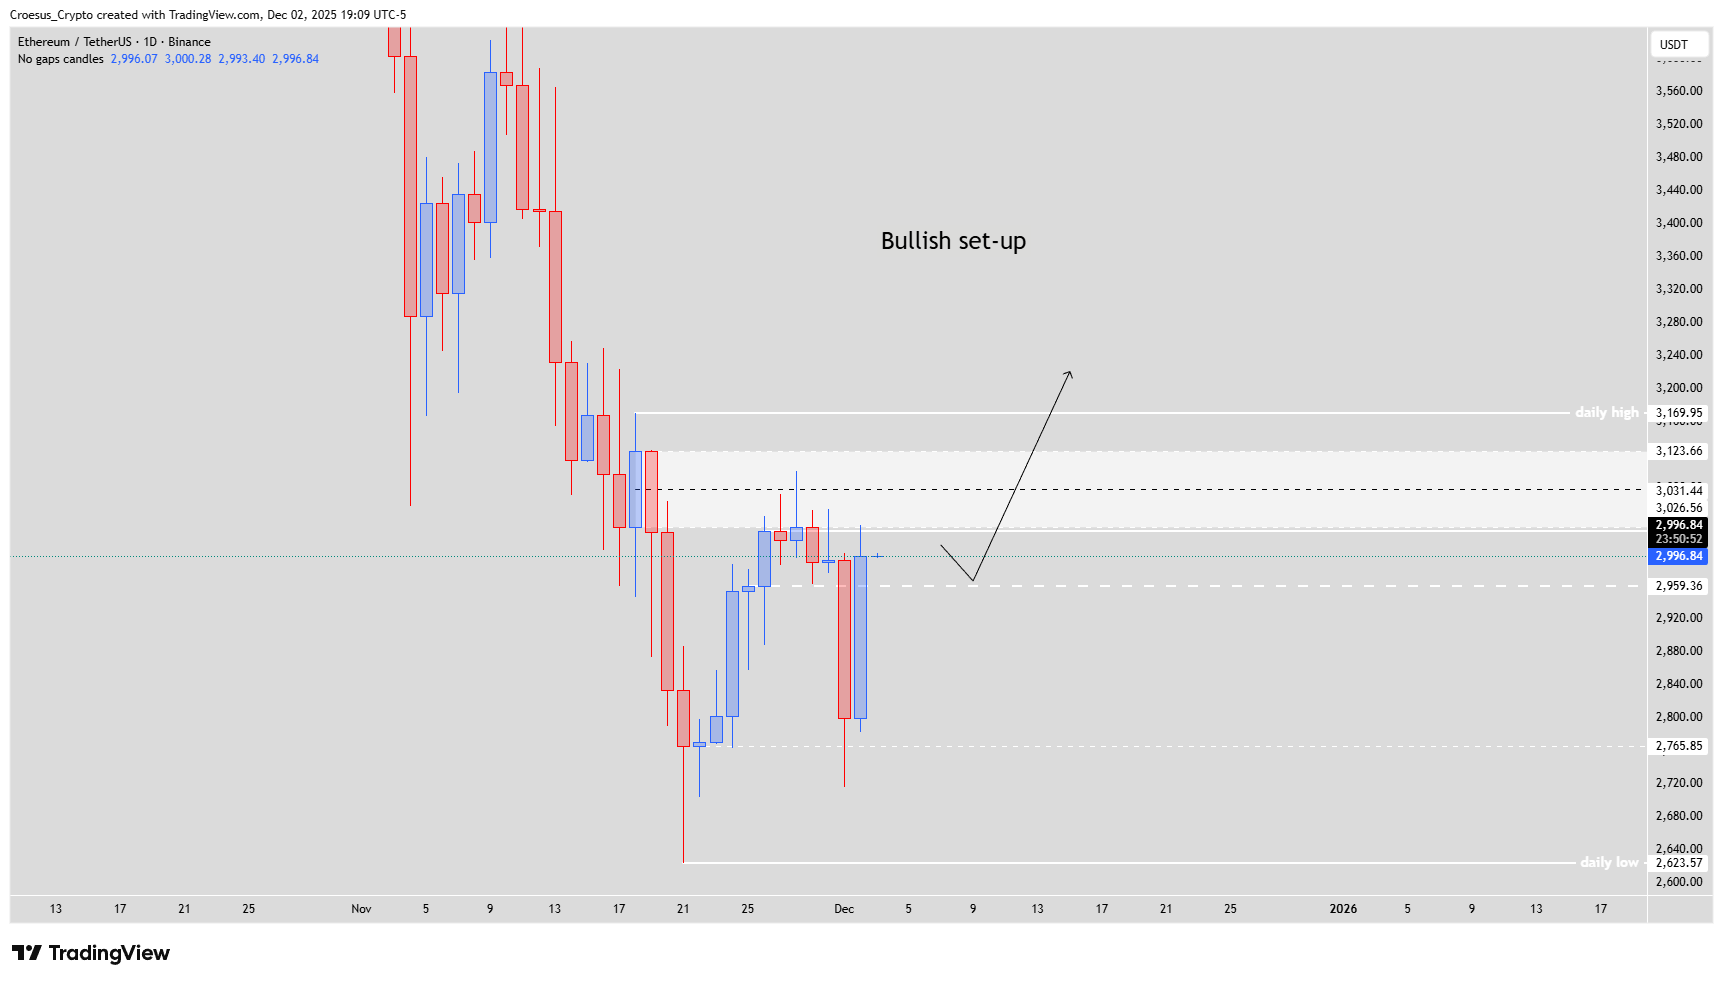
- Bullish set-up : switch of momentum + respecting the level $2.959,36 as shoulder level, showing us the formation of a inverse head and shoulders pattern.
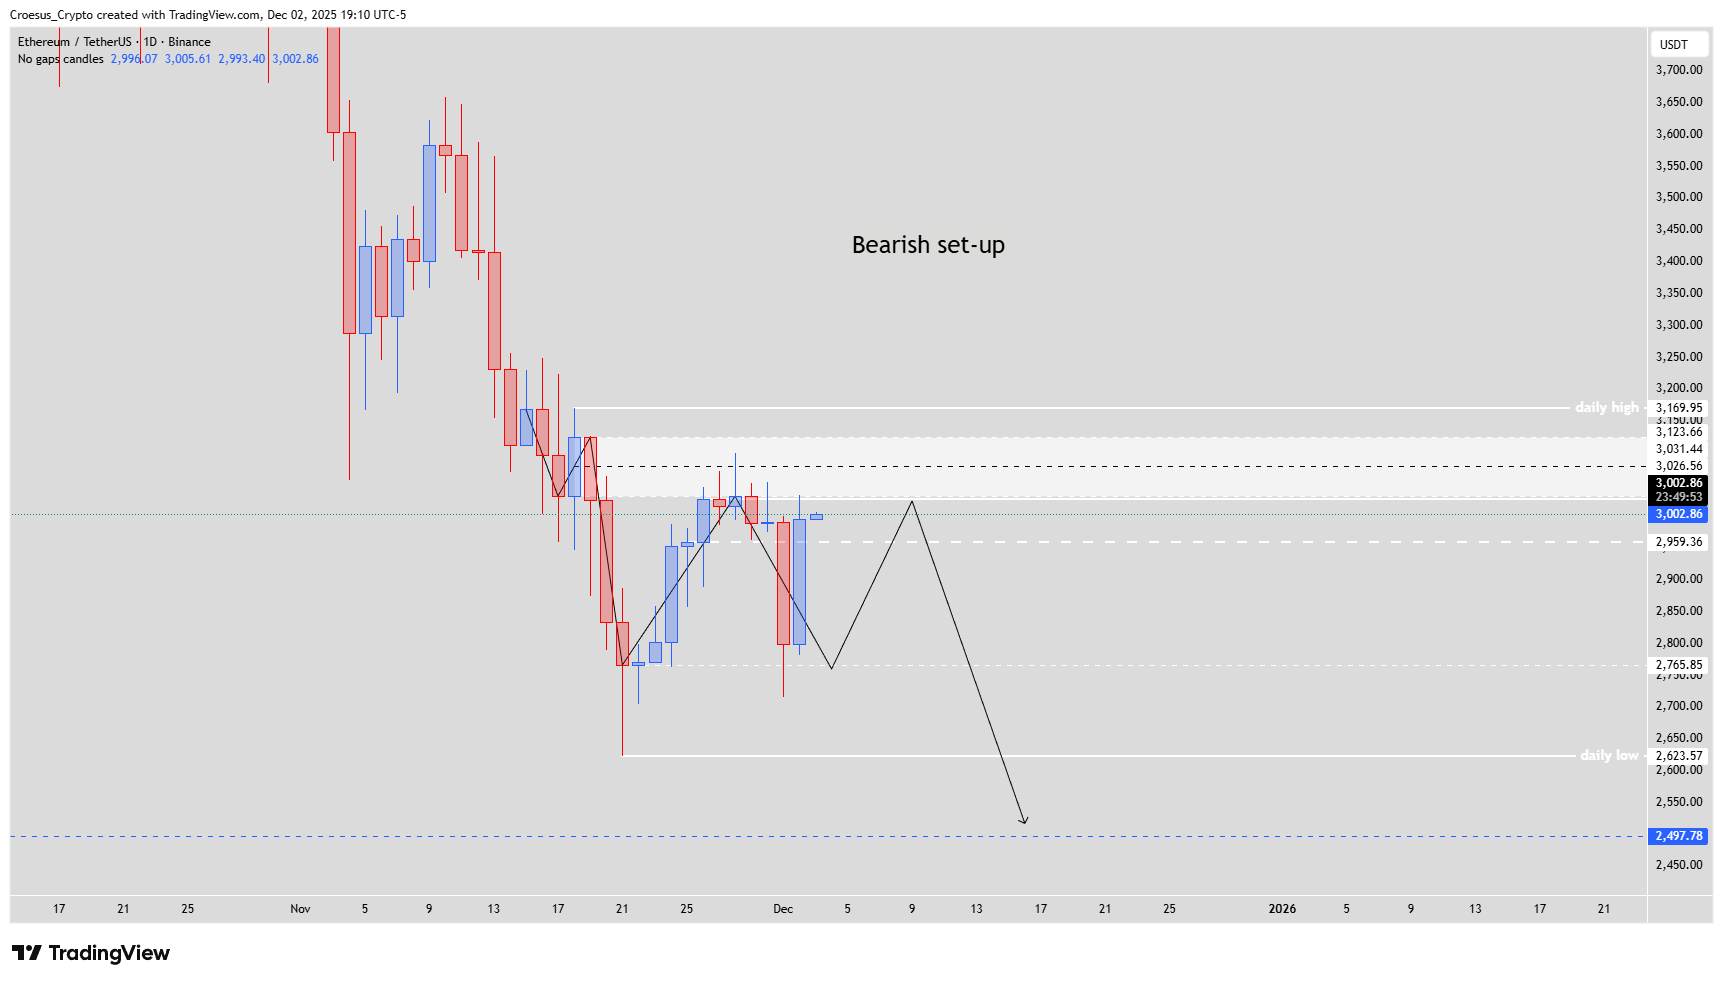
- Bearish set-up : as long as the daily high has not been broken, we are still in a bearish trend. This means that the formation of a natural bearish W pattern is still in play. After printing a first bearish W, the price prints equal lows and equal highs. This confirms the strength of the first bearish W, indicating possible bearish continuation.
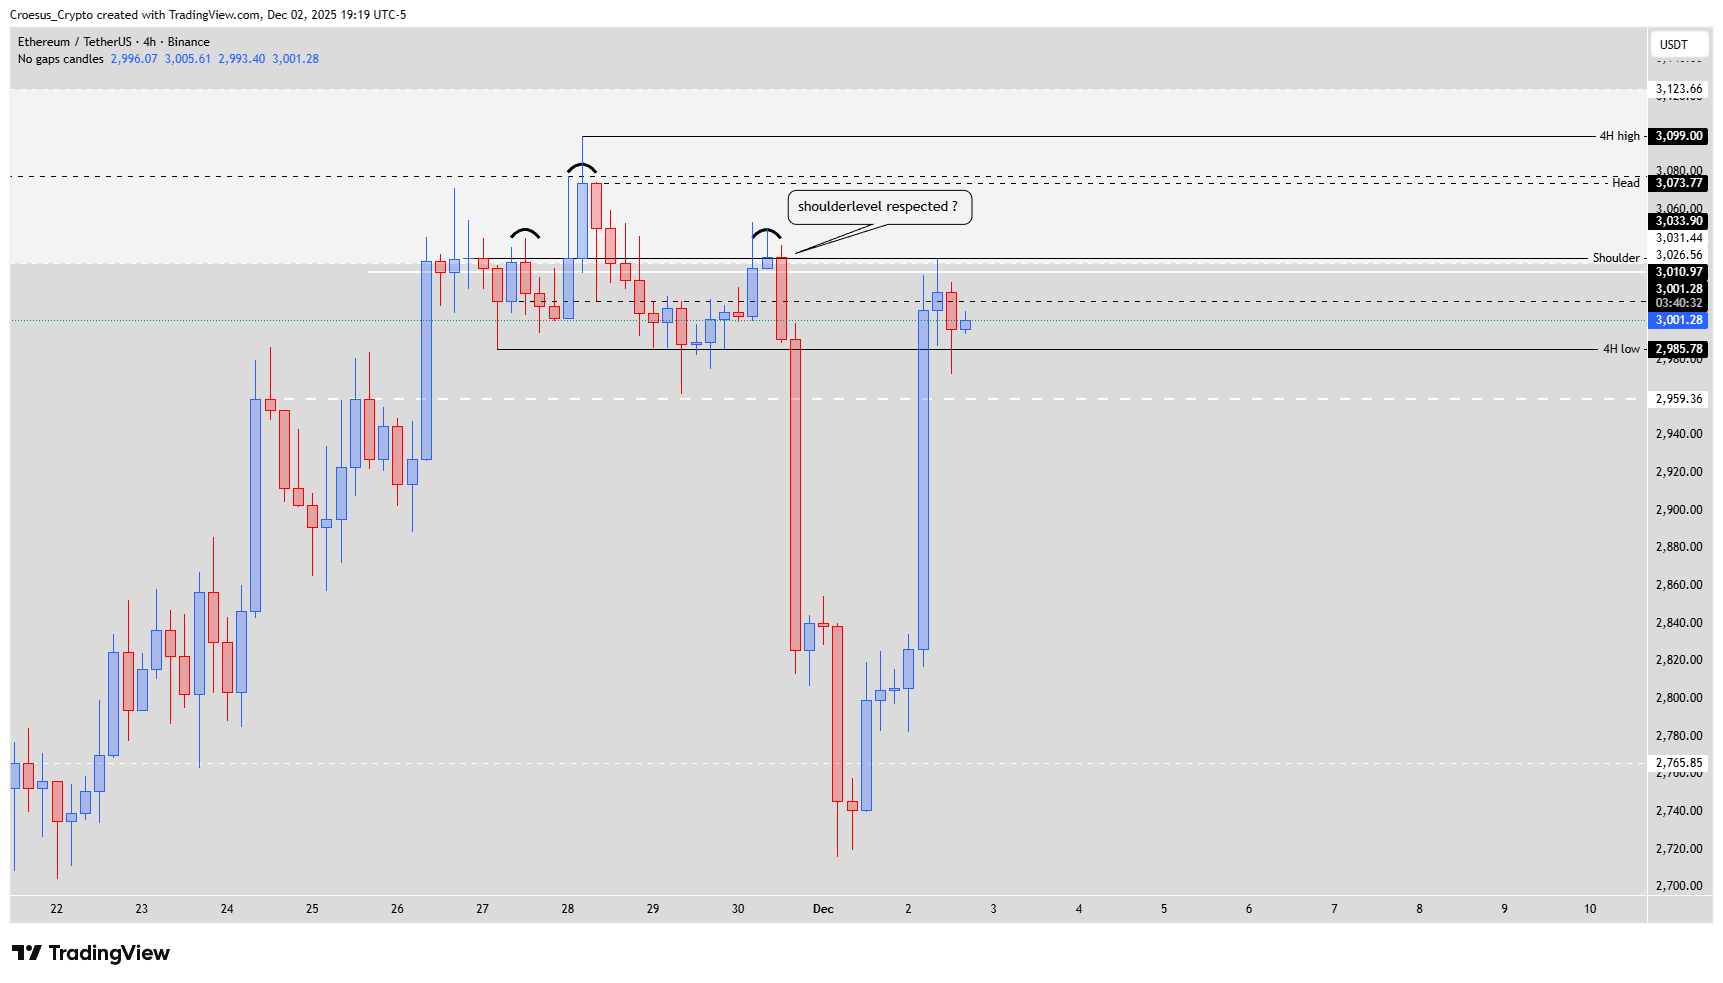
- If we zoom in on the 4H timeframe, we can see that the price retraced exactly to the 4H shoulder level. At the beginning of the week we indicated that the price did not respect the shoulder level entirely and that we thought that the price might retrace towards this level in order to respect it. This now happened. Would this mean an indication of further bearish continuation ?
Market Structure Analysis
From a market-structure perspective, Ethereum daily analysis shows price bouncing from daily liquidity into a mid-range where both buyers and sellers are active. If the $2.959,36 area continues to hold as a shoulder, the inverse head and shoulders idea gains credibility and could mark the start of a deeper corrective leg higher.
However, the dominant structure remains bearish as long as the daily high above price is untouched. In that case ETH can still build a natural bearish W: equal lows and equal highs forming below resistance, reinforcing the prior bearish W and signalling that sellers remain in control. Traders may later overlay Fibonacci tools for precision, but the key signal now is whether the neckline/daily high is rejected or broken.
Key Levels and Scenarios
Bullish scenario: price respects $2.959,36 on any retrace, forms a clean right shoulder and then breaks above the daily high, invalidating the natural bearish W and opening room for a broader recovery.
Levels to watch:
Daily liquidity zone: origin of the current bounce and short-term support.
$2.959,36 shoulder level: must hold to keep the inverse H&S valid.
Local range mid-structure: reaction here shows whether bulls can maintain the momentum switch.
Daily high / resistance: failure here favours continuation of the bearish W pattern.
Equal highs / equal lows band: if established again, it confirms bearish continuation within the prevailing downtrend.
Trading Implications
For active traders, this is a classic inflection zone: conservative participants may wait for either a confirmed break of the daily high or a clear rejection and renewed lower lows, while aggressive traders can structure tighter-risk plays around the shoulder level or daily resistance, using appropriate position sizing and always respecting volatility.
This publication is for educational purposes only and does not constitute financial advice or a recommendation to buy or sell any asset.