


In this Ethereum daily analysis for early December 2025, we see ETH printing a first-time break of structure above the prior daily high, signalling a fresh bullish impulse after a prolonged downtrend. Our technical analysis now focuses on whether this new bullish leg can sustain, or if the current pause evolves into a deeper correction back into support resistance around the recent breakout zone.
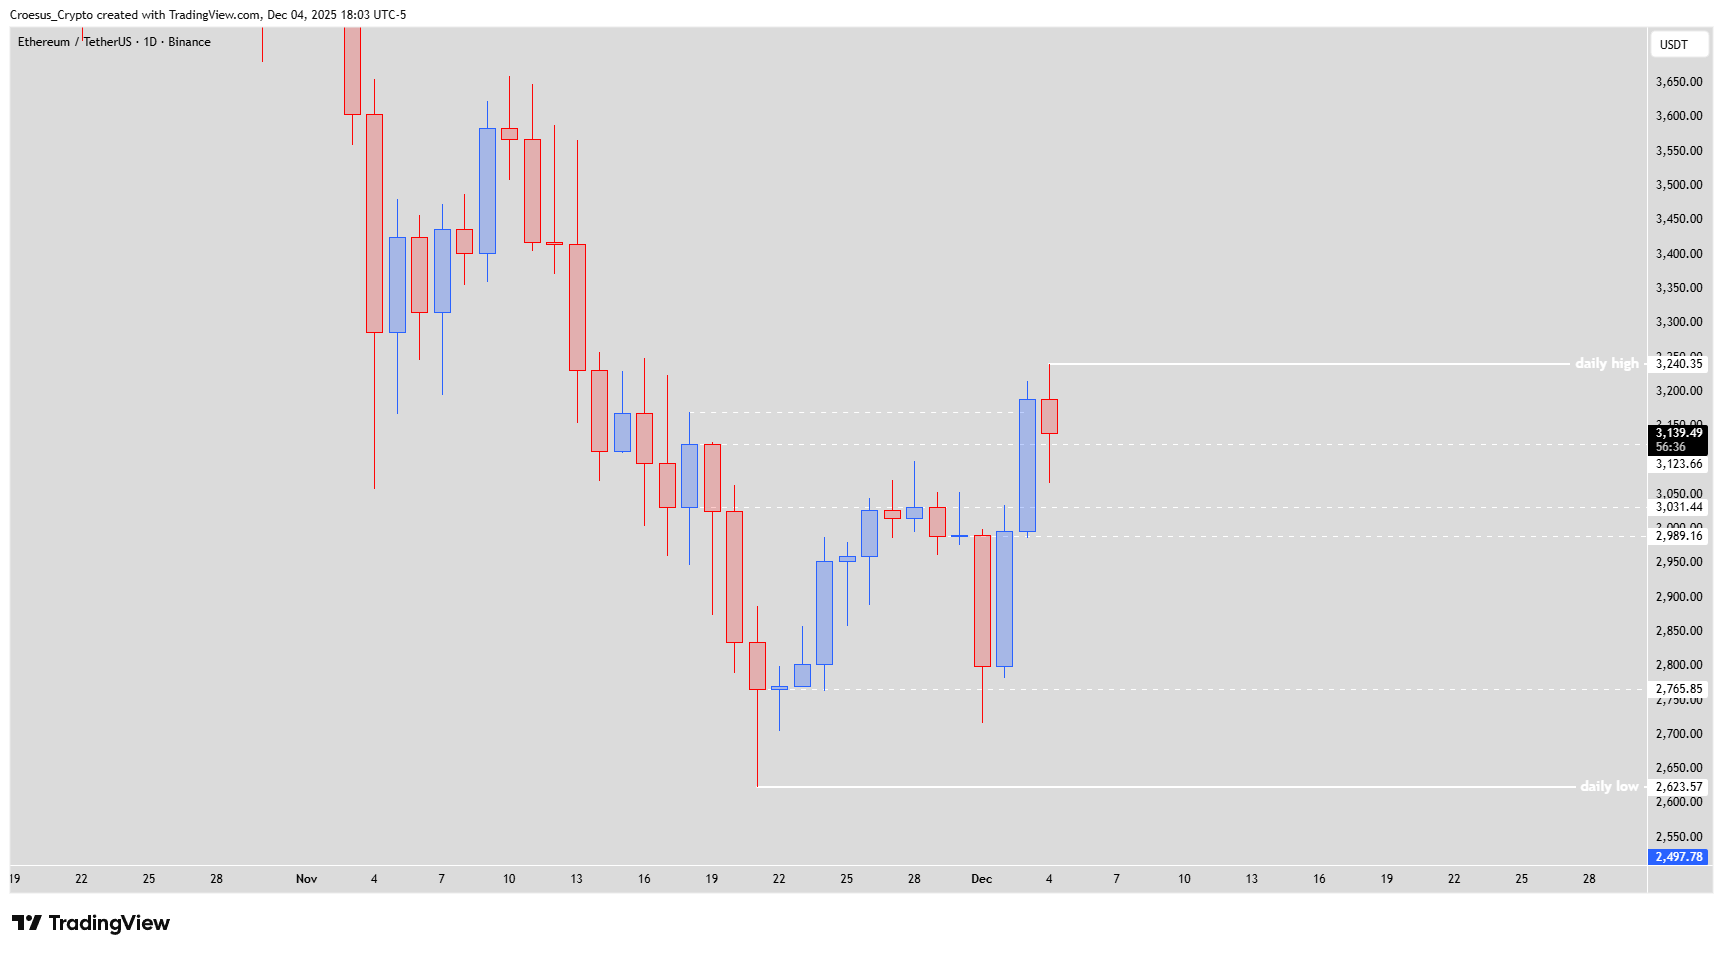
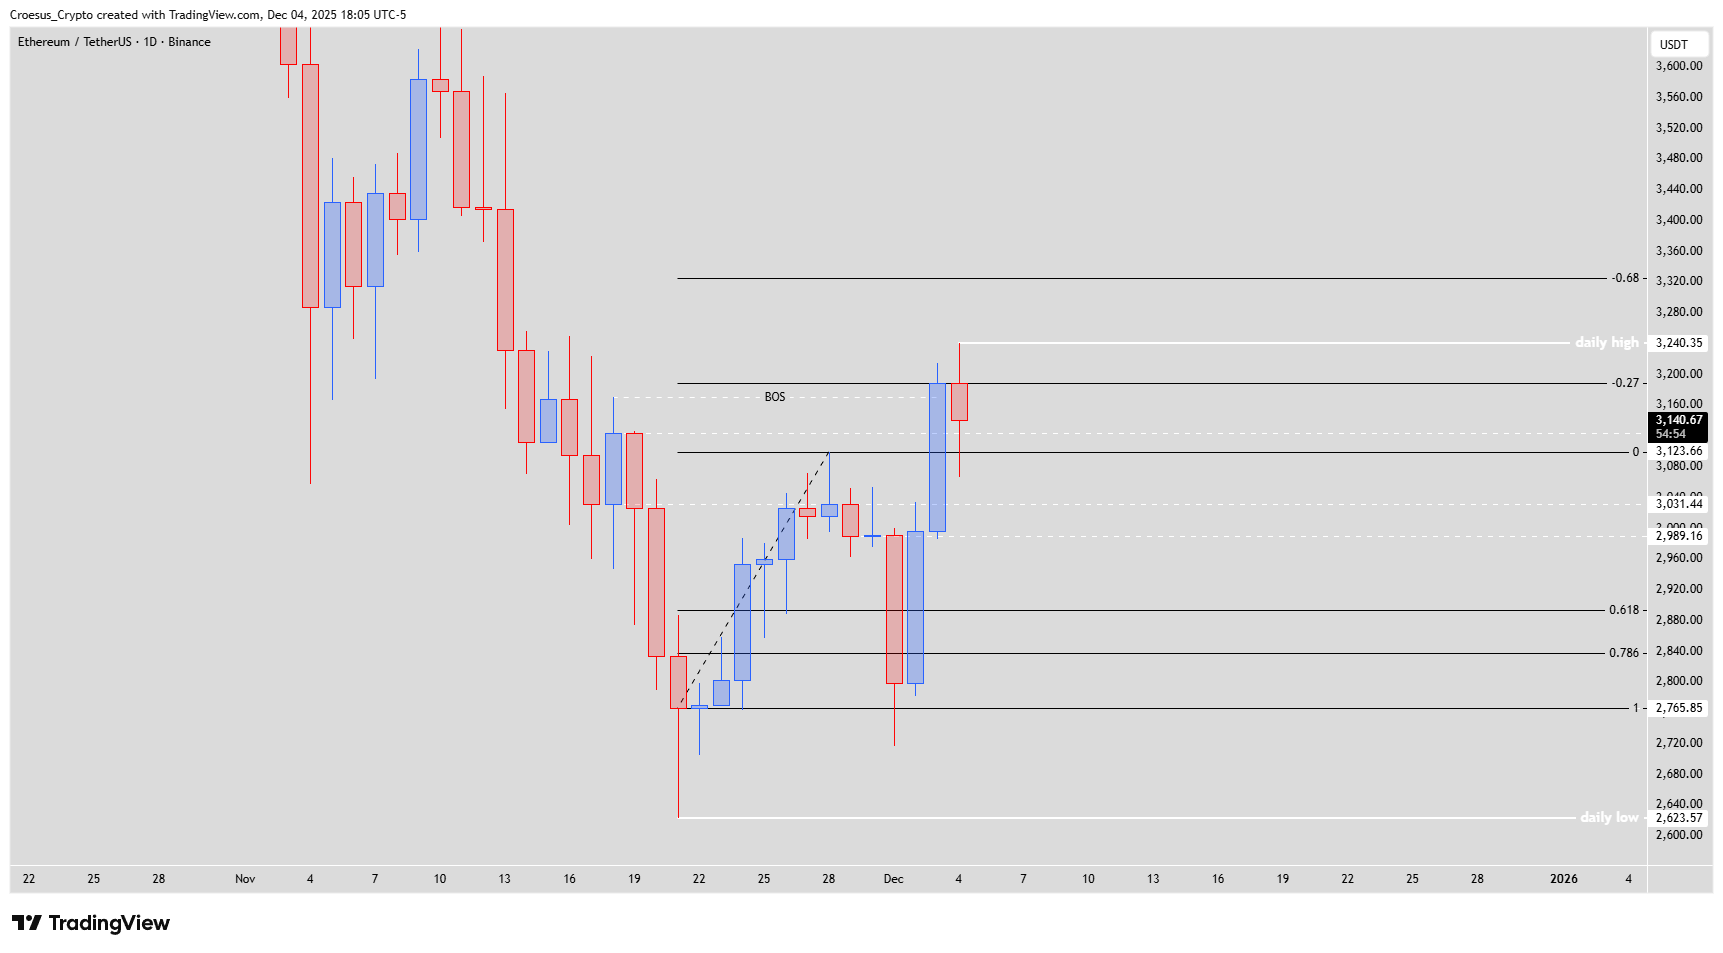
ETH daily chart 4 Dec 2025 showing broader downtrend, new BOS above daily high and current consolidation zone.
Trend = bullish ↑
Technical Analysis Key Points
- Yesterday the candle closed above the daily high, creating a break of structure (BOS) and a first time break. We have seen a clear switch of momentum with the two bullish candles of the prior two days.
- But today the price stalled, potentially indicating a point where price may pause and even correct a little.
- If we look at the fib retracement of the first leg up, we saw the price making a nice pullback towards the 100% fib retracement level, followed by the impulsive bullish move up. This move was halted yesterday exactly at the -0.27 fib level.
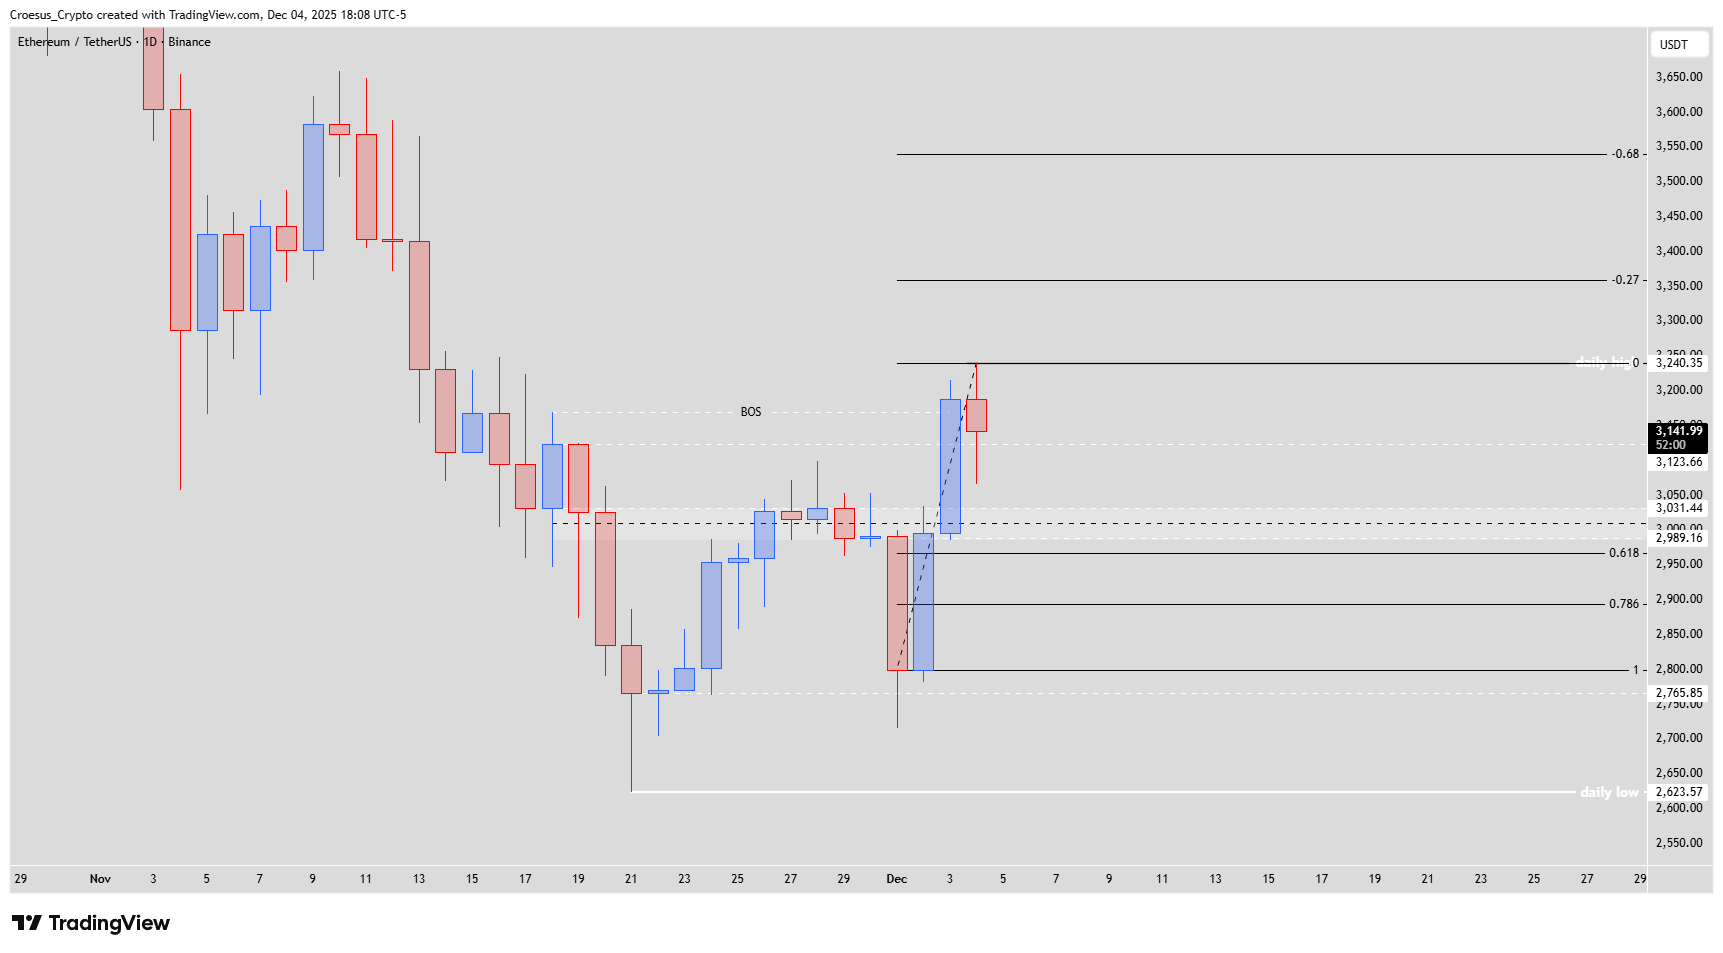
- At this moment we can see an potential inverse head & shoulder pattern with a double bottom. We are still talking about "potential" because we haven't seen a validated switch of trend (second higher high).
- Bullish set-up : switch of momentum + respecting the level $2.959,36 as shoulder level, showing us the formation of a inverse head and shoulders pattern.
Market Structure Analysis
Our Ethereum daily analysis shows a clear BOS: closing above the former daily high confirms buyers have taken short-term control and establishes a new higher high. However, today’s stalling candle at the -0.27 Fibonacci extension hints at a possible pause or corrective phase before any continuation. The prior pullback to the 100% Fibonacci retracement of the first leg up acted as an efficient reload zone, from which the impulsive bullish move originated.
Structurally, we now monitor the potential inverse head and shoulders with a double bottom forming around the recent lows. As long as price respects $2.959,36 as a shoulder level and holds above that zone, the bullish market structure remains constructive. A second convincing higher high would formally confirm the larger trend switch, while a sharp break back below the shoulder level would question this early bullish narrative and reopen the door to deeper downside.
Key Levels and Scenarios
Bullish scenario: Price consolidates or gently corrects toward $2.959,36, holds that area as support, and then pushes higher to print a second higher high above the recent BOS peak, extending toward the next Fibonacci extensions.
Key levels to watch:
Daily high / BOS level: New support; losing this level would weaken the breakout.
$2.959,36 shoulder level: Critical support for the potential inverse H&S and double bottom.
-0.27 fib extension zone: Current resistance where price is stalling.
100% fib retracement of first leg: Proven demand area from the previous pullback.
Daily low region: Only relevant again if bullish structure fully fails.
Trading Implications
For active traders, the primary plan in this technical analysis is to trade with the new bullish momentum: focus on pullbacks toward $2.959,36 and the BOS area for potential long entries, use clear invalidation just below the shoulder level, and size positions conservatively while the inverse head and shoulders remains only a “potential” pattern.
This content is for educational purposes only and is not financial advice or a recommendation to buy or sell any asset.