


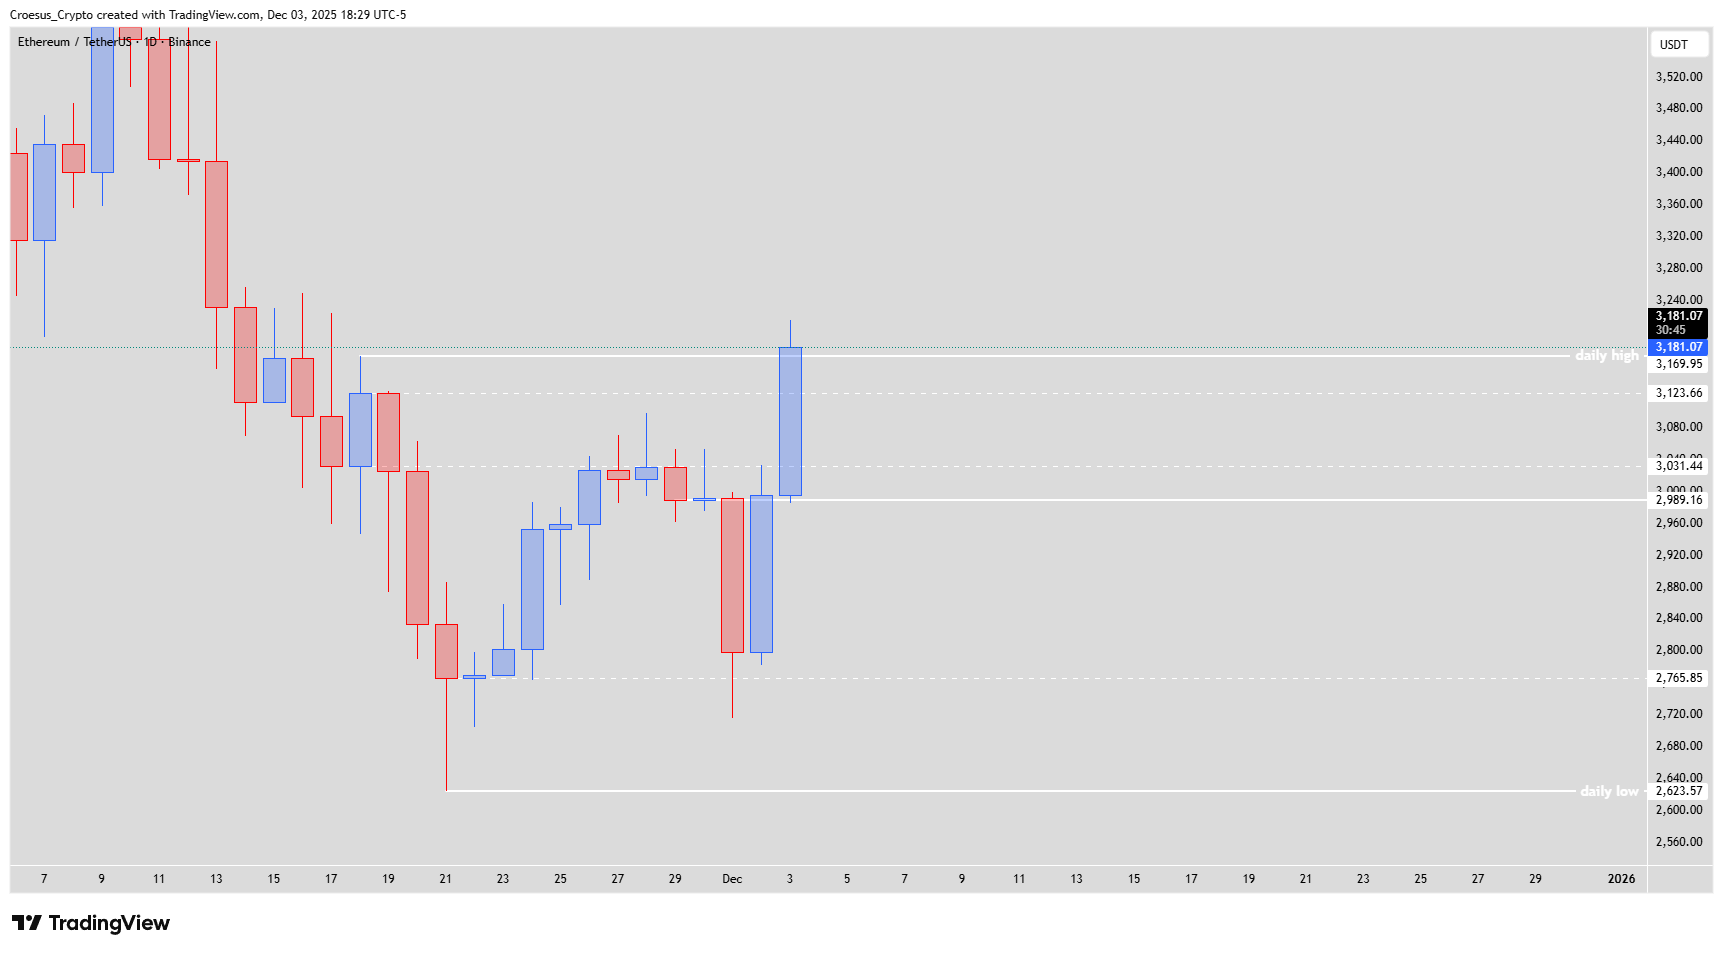
In this Ethereum daily analysis for December 2025, price continues higher into the daily high after a sharp bounce from recent lows. We are tracking whether this push confirms a new bullish reversal or fades back into the existing bearish structure defined by the prior sell-off. This technical analysis is built purely on price action and clear support resistance levels.
Ethereum ETHUSDT daily chart early Dec 2025 zoomed on candle testing daily high after strong impulse from recent lows
Trend = bearish ↓
Technical Analysis Key Points
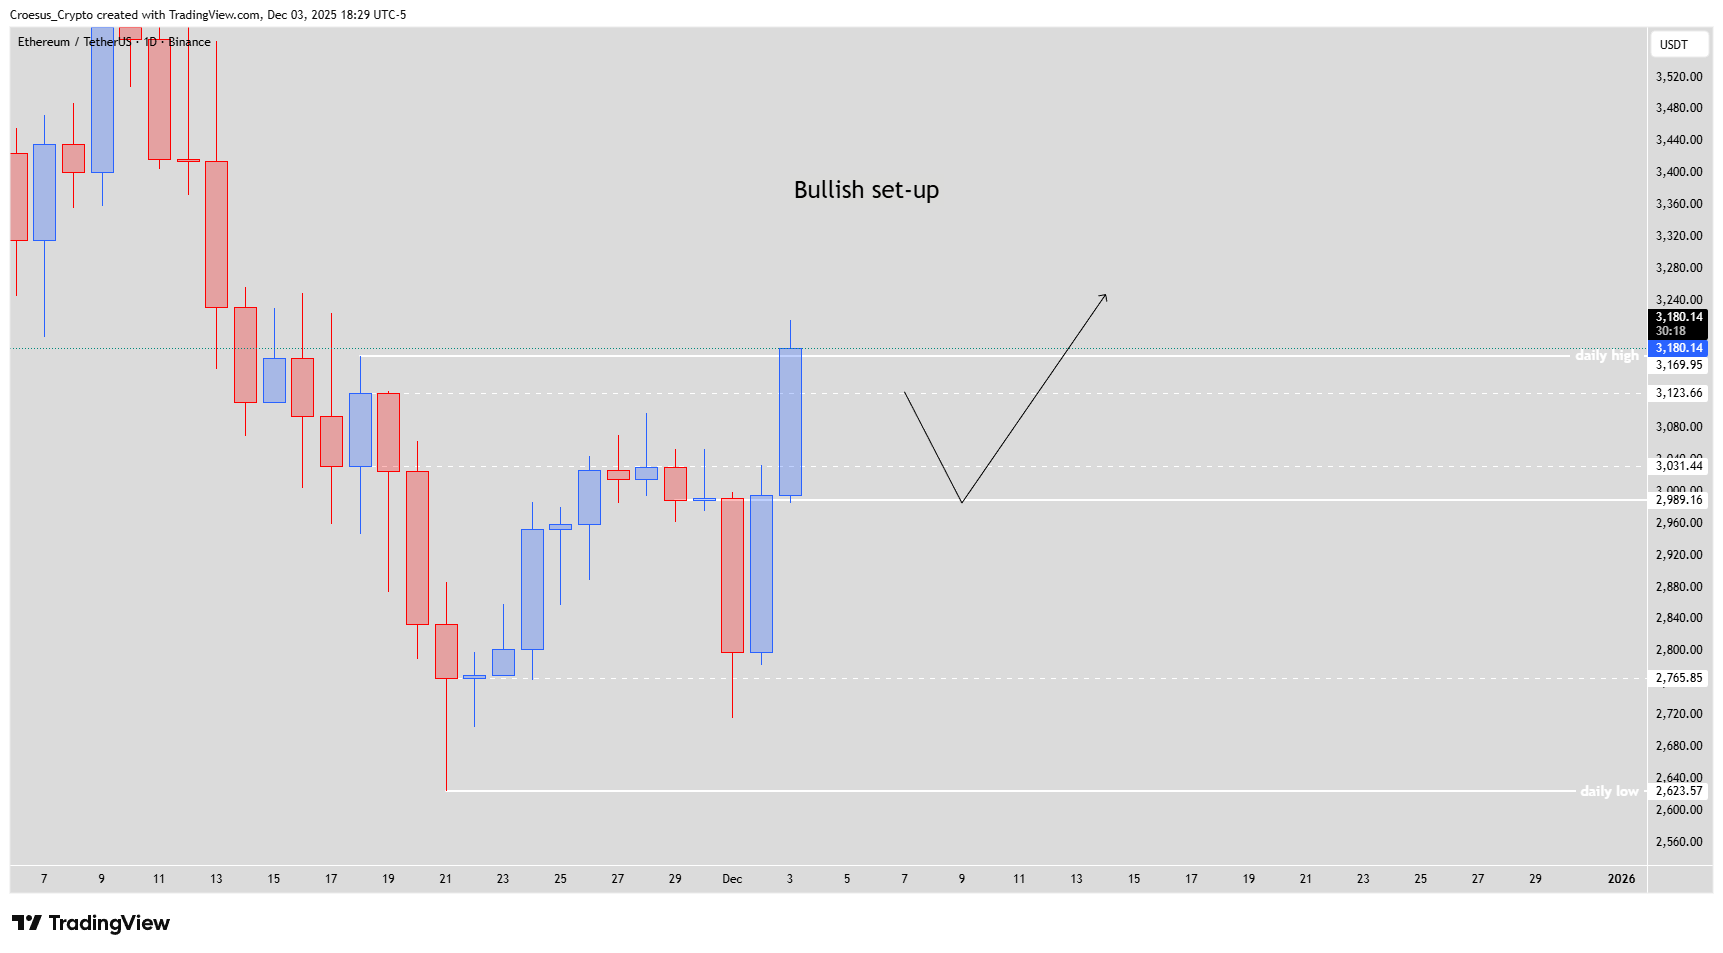
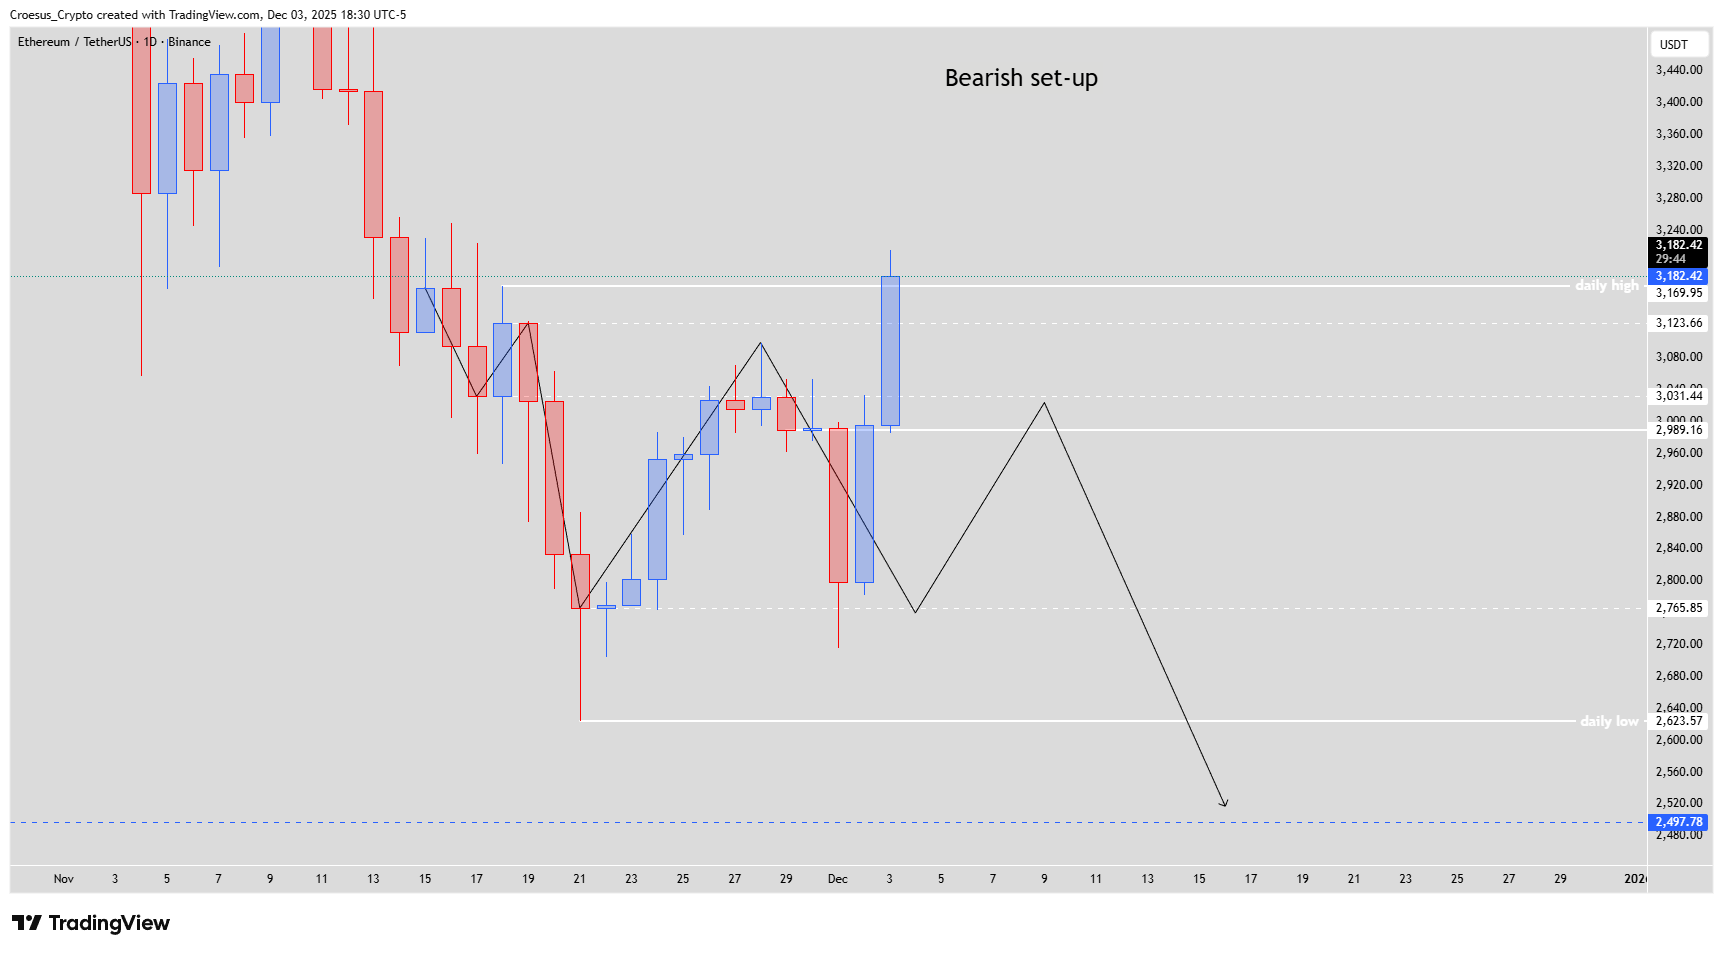
- Today the price continued higher testing the daily high. The candle is not closed entirely. If the candle closes above, the bullish set-up is preferable. If the candle closes below, the bullish set-up remains possible, but the bearish set-up remains valid.
- Bullish set-up : switch of momentum + respecting the level $2.959,36 as shoulder level, showing us the formation of a inverse head and shoulders pattern.
- Bearish set-up : as long as the daily high has not been broken, we are still in a bearish trend. This means that the formation of a natural bearish W pattern is still in play. After printing a first bearish W, the price prints equal lows and equal highs. This confirms the strength of the first bearish W, indicating possible bearish continuation.
Market Structure Analysis
Our Ethereum daily analysis shows price testing the daily high, a key support resistance zone after the previous decline. A daily close above this level would confirm a switch of momentum and keep the inverse head and shoulders scenario alive, with $2.959,36 acting as the potential shoulder and main demand area on a retrace.
If the candle closes back below the daily high, the dominant structure remains bearish. The natural bearish W pattern—first W followed by equal lows and equal highs—signals that rallies into resistance are still corrective and can lead to renewed downside continuation. Fibonacci tools could be layered on these structures, but the key message remains that the daily high is the pivotal line between trend continuation and reversal.
Key Levels and Scenarios
Bullish scenario: Daily candle closes and holds above the daily high, followed by a controlled pullback toward $2.959,36 that is defended by buyers, confirming the shoulder of the inverse H&S and opening room for higher highs.
Key levels to monitor:
Daily high: decisive close above favors sustained bullish momentum.
$2.959,36: shoulder level and main support in the bullish setup.
Equal highs zone: rejection here strengthens the natural bearish W.
Equal lows area: break below signals renewed bearish continuation.
Recent swing low region: deeper downside target if selling pressure resumes.
Trading Implications
From a trading perspective, this technical analysis suggests waiting for the daily close relative to the high, then using the daily high and $2.959,36 as clear invalidation levels, with position sizing and risk tightly controlled around these zones rather than pre-empting either scenario.
This content is for educational purposes only and is not financial advice or a recommendation to buy or sell any asset.