


ETH Marketcap / Ethereum
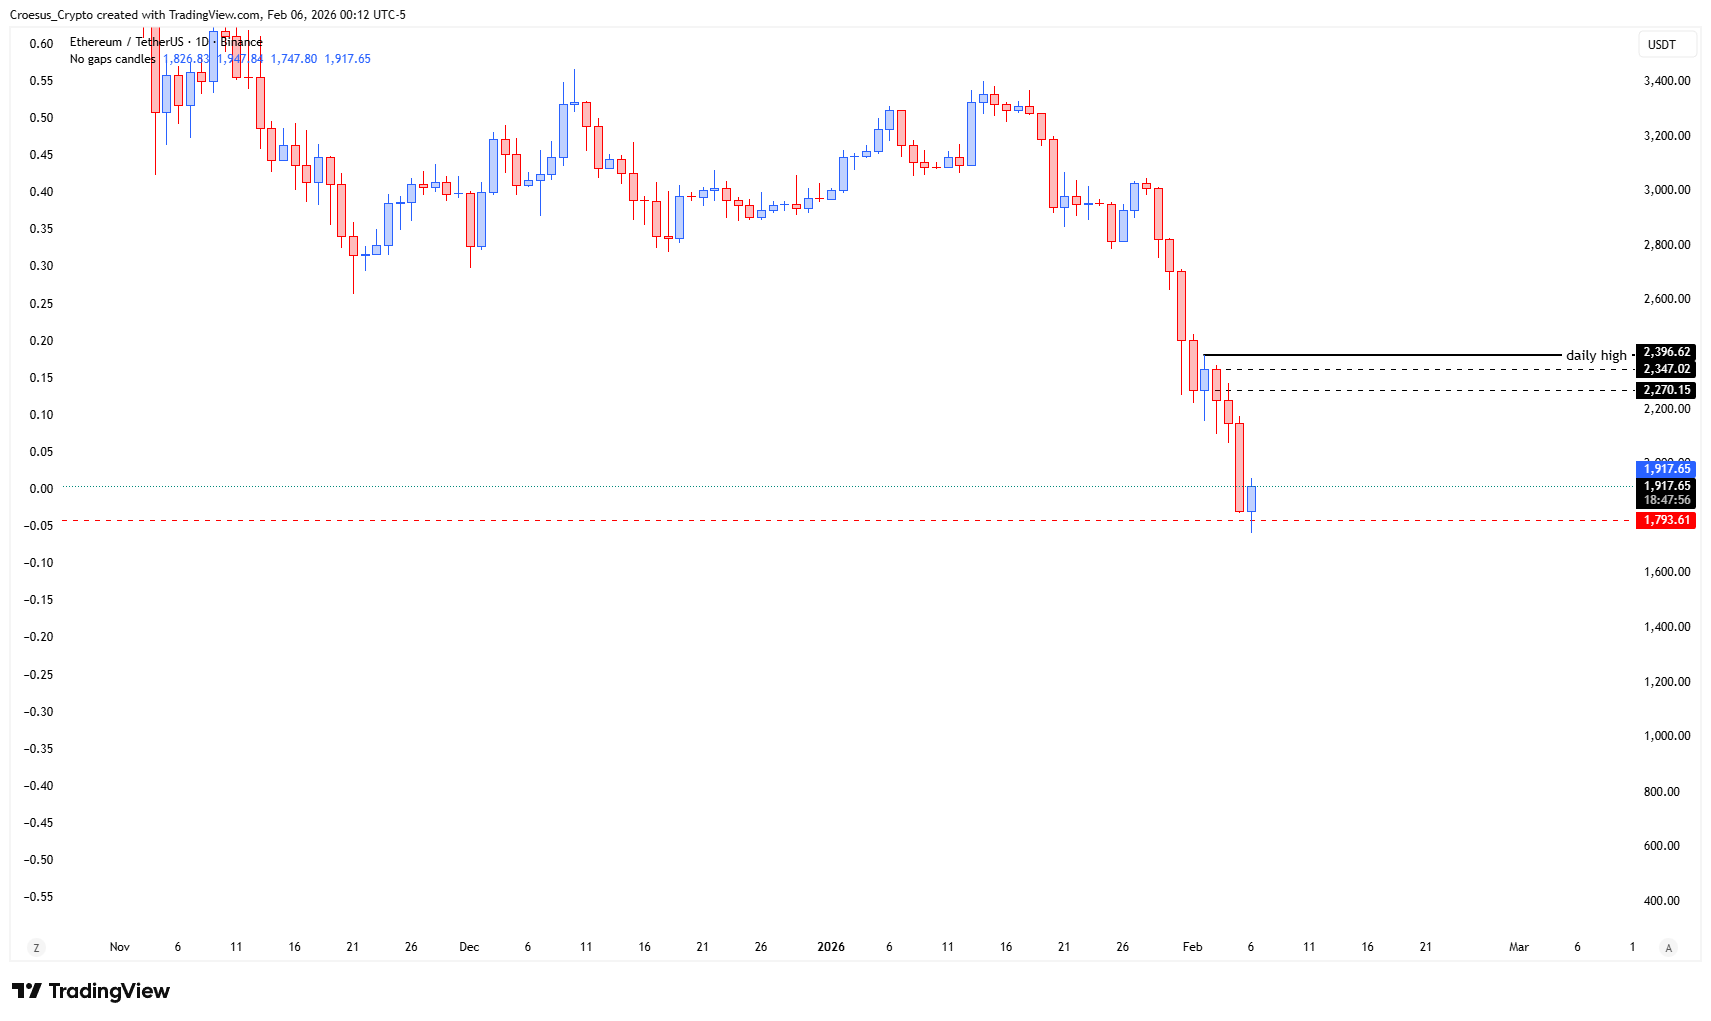
ETH weekly analysis 05 February 2026. Ethereum is trading in a fragile state after a short-lived relief bounce, with our technical analysis still favoring bearish continuation unless buyers show clear commitment at the current structural level.
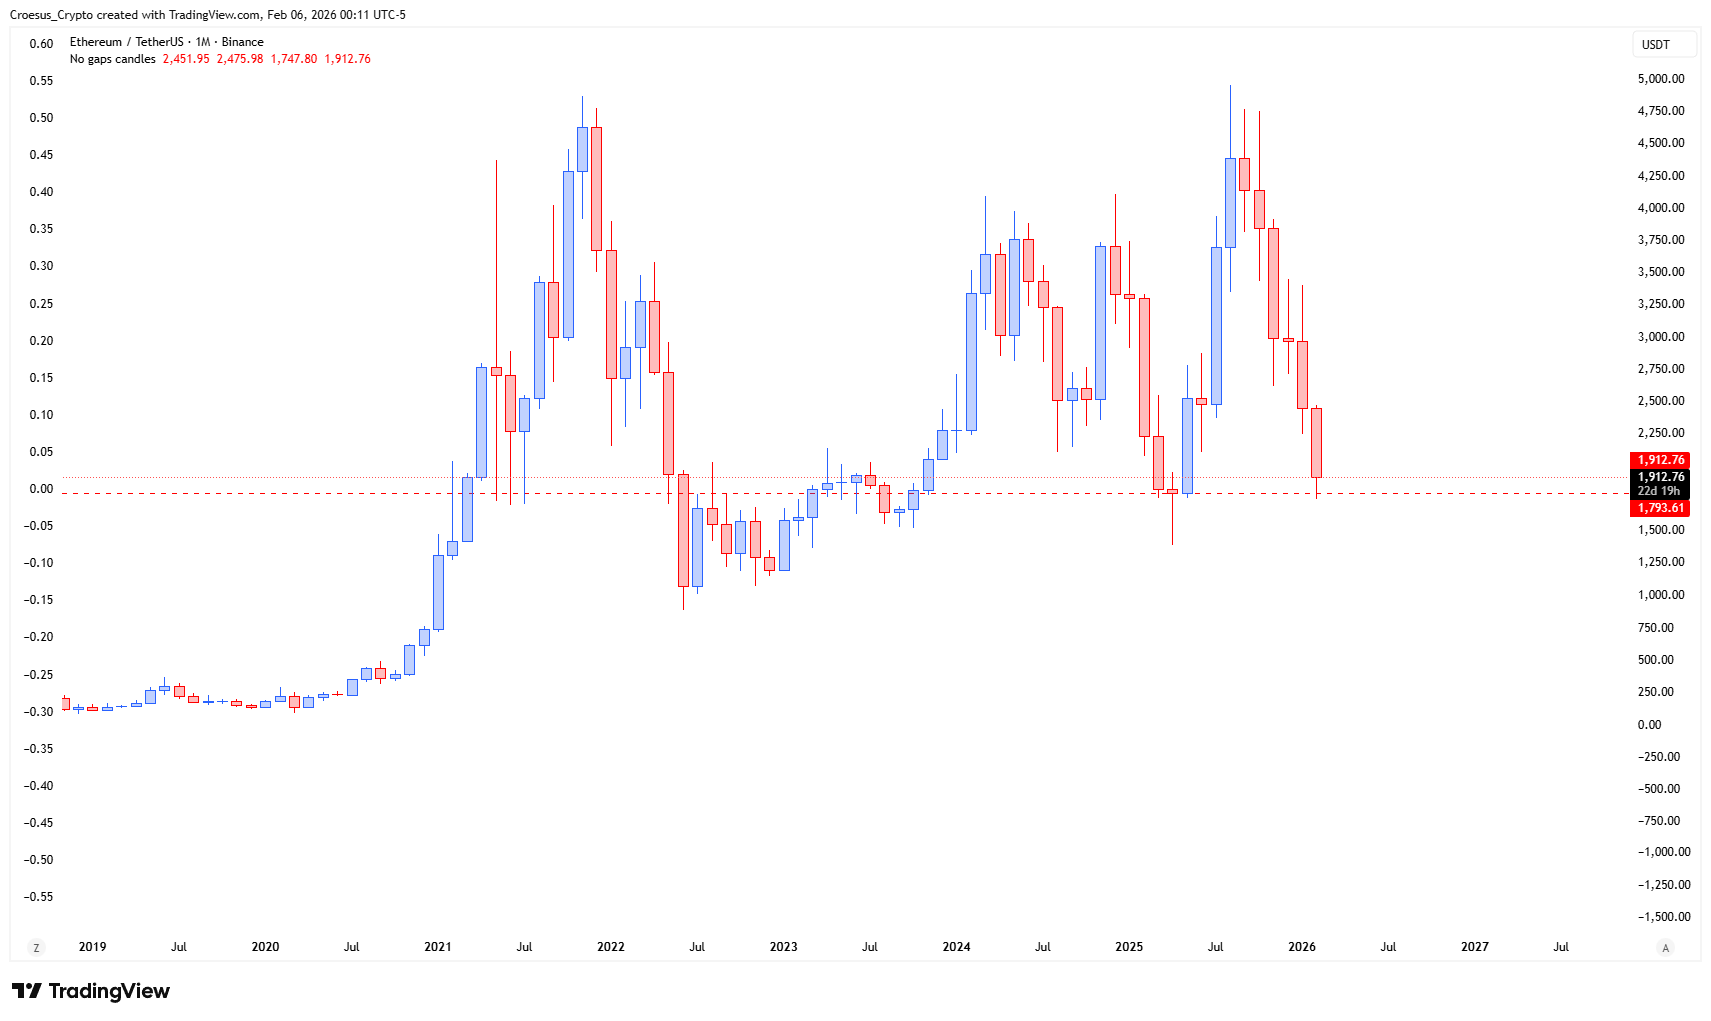
- The price shows us, after a slight bullish relief, clear bearish continuation.
- if we zoom out to the monthly chart, we can see that price hit a prior low.
- This is a key level, potentially acting as a support zone. But after such impulsive downside weeks, we need to see proof that bulls are present and that we start building bullish reversal.
Market Structure Analysis
From a market structure perspective, ETH weekly analysis remains bearish because the latest upside attempt reads as a corrective relief move rather than a new impulsive leg higher. Price is now interacting with a prior low visible on the monthly chart, which is a classic area where liquidity sits and where reactions can be sharp. However, the context matters: the downside move into this area was described as “impulsive,” which typically signals strong bearish control and reduces the probability of an immediate V-shaped reversal. For Ethereum to shift structure, we want to see evidence of demand absorbing sell pressure at this support resistance zone, followed by a sustained push that starts forming a bullish reversal sequence (base-building, higher low structure, and a break of key resistance).
Key Levels and Scenarios
In this ETH weekly analysis, the bearish scenario stays in play if price fails to hold the prior-low support zone and sellers keep printing continuation legs. A more constructive scenario requires clear bullish “proof” at this level: reduced downside follow-through, visible rejection wicks, and structure that transitions from corrective to impulsive on rebounds.
- The prior monthly low zone as the primary support area price is testing now
- The current consolidation/reaction area as the decision zone for bulls to defend
- The relief-bounce area overhead as the first resistance sellers can defend on retests
- A clean bullish reversal structure as the key condition to invalidate continuation risk
Trading Implications
With trend conditions still bearish, aggressive participants typically treat bounces as corrective until structure flips, while conservative traders often wait for a confirmed reversal (base + break of structure) before assuming the low is in. Risk remains elevated around this support zone because impulsive downtrends can continue even after brief relief rallies.
This analysis is for informational purposes only and does not constitute financial advice.