


In this ETH daily analysis for 6 December 2025 we look at how Ethereum reacts after yesterday’s clean pullback into the IC-zone. Our technical analysis highlights a tight 4H range, a potential inverse head and shoulders base, and the key support resistance levels that will decide the next impulsive leg.
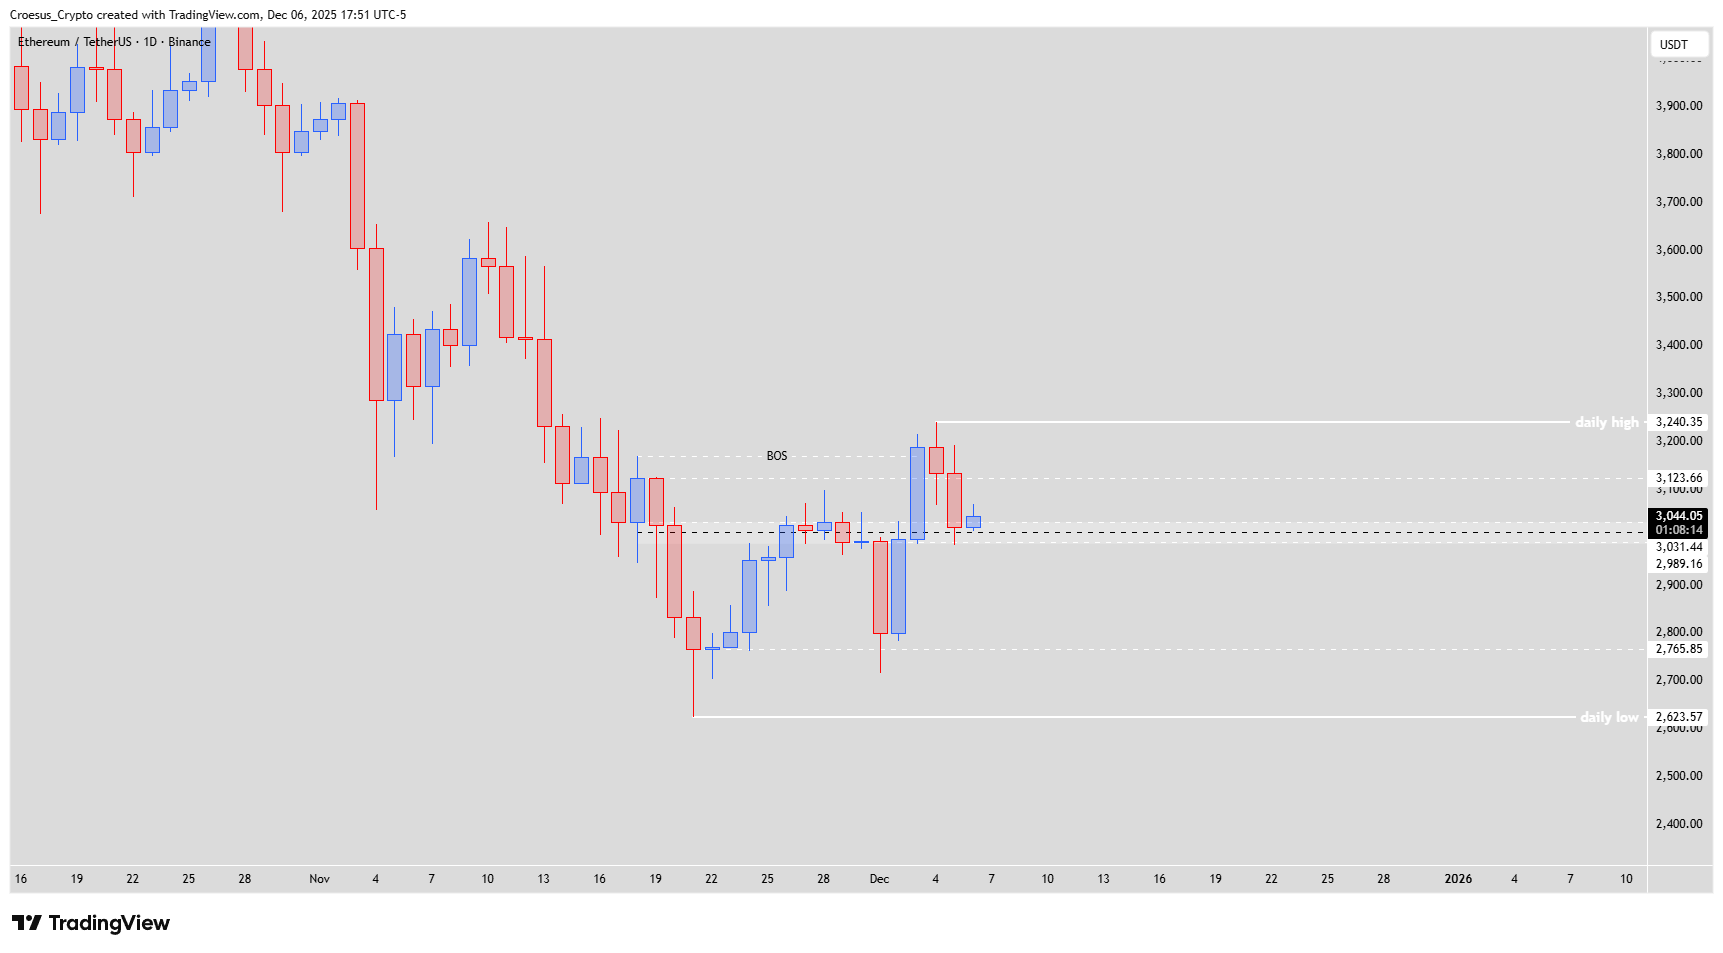
ETH daily chart 06-12-2025 with BOS level, IC-zone retest and potential inverse head and shoulders structure
Trend = bullish ↑
Technical Analysis Key Points
- Yesterday the price pulled back nicely towards the IC-zone as analyzed.
- Only today we did not see a clear bullish reaction. Reason could be that retail is not interested or has a lack of volume to move the price. What we noticed this bullrun is, that weekends are not the place and time for big moves, showing us that institutional traders are dominant also in the crypto market.
- When we zoom in on the 4H, we can see that the price is caught in a thight range. We would need to see a breakout towards the upside in order to be convinced of any bullish presence.
- At this moment we can see an potential inverse head & shoulder pattern with a double bottom. We are still talking about "potential" because we haven't seen a validated switch of trend (second higher high).
- Bullish set-up : switch of momentum + respecting the level $2.959,36 as shoulder level, showing us the formation of a inverse head and shoulders pattern.
Market Structure Analysis
On the daily chart, ETH recently showed a bullish break of structure (BOS), but price has since retraced back into the IC-zone just above 3,000 USD. Today’s session is mostly sideways, with candles clustering in a narrow band around 3,020–3,050 USD, which our ETH daily analysis interprets as indecision rather than clear demand.
The 4H chart confirms this: internal structure failed to push convincingly higher and price is stuck in a tight consolidation. Until we see a clean 4H breakout with follow-through, the inverse head and shoulders remains only a “potential” pattern. For now, the IC-zone and the 2.959,36 USD shoulder region act as the main reference area where buyers must step in to defend the BOS and avoid a deeper retrace. Traders can combine this technical analysis with their own Fibonacci confluence checks, particularly around the IC and shoulder levels.
Key Levels and Scenarios
Bullish scenario:
A clear momentum switch on 4H, with a strong impulsive candle breaking out of the range and then respecting 2.959,36 USD as the right shoulder. Holding above this level and reclaiming the mid-3,100s resistance would validate the inverse head and shoulders and reopen the path toward the daily high around 3,240 USD.
Key levels to watch
3,240 USD – daily high: Main upside objective if the inverse H&S confirms.
3,123–3,100 USD – BOS / resistance band: First major resistance to reclaim.
3,044 USD area – current range centre: Intraday balance point; break above signals bulls stepping in.
2.959,36 USD – potential shoulder level: Must hold in the bullish setup.
2,765–2,623 USD – lower daily support zone: Risk area if IC and shoulder fail.
Trading Implications
For now, patient traders may wait for either a decisive 4H breakout above the range with stops below 2.959,36 USD, or evidence of failure at resistance leading back into the lower daily supports, always sizing positions conservatively relative to ETH volatility.
This content is for educational purposes only and is not financial advice or a recommendation to buy or sell any asset.