


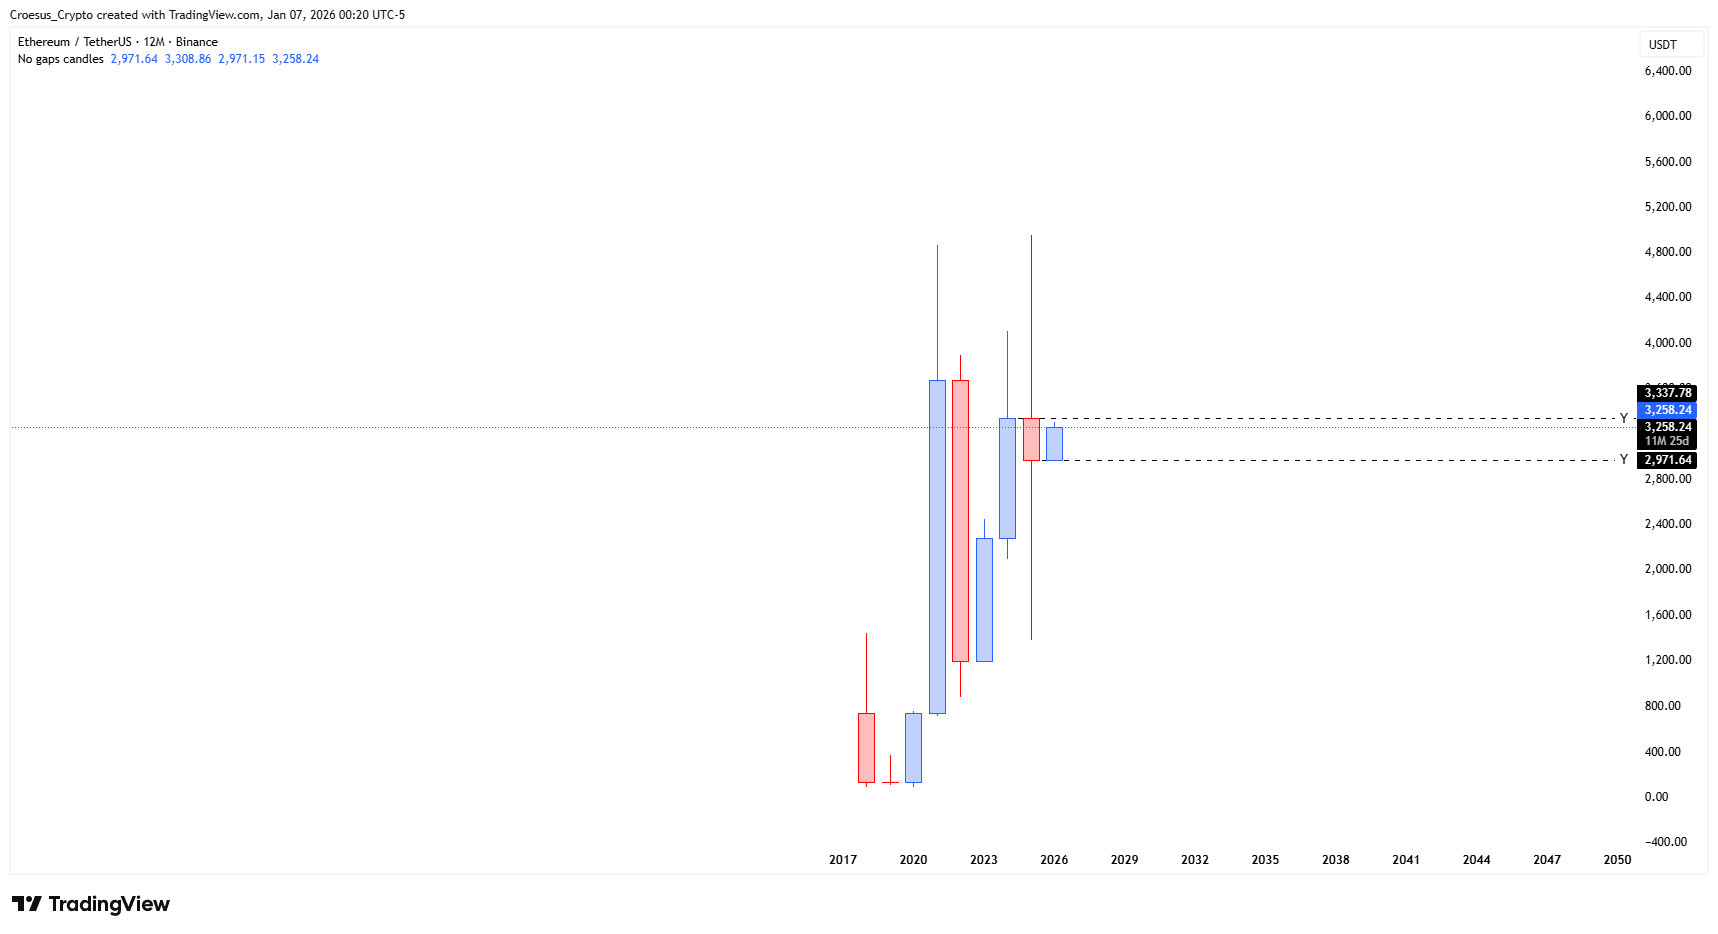
In this Ethereum daily analysis for 06 January 2026, we start from the yearly view. After the yearly close, price has almost reached the 2025 yearly open, effectively retracing the entire 2025 candle within just 6–7 daily sessions. This highlights a strong but very fast bullish impulse that brings ETH straight back into a major yearly support resistance area.
Ethereum yearly chart January 2026 with price almost retesting the 2025 open and highlighting key yearly support resistance band.
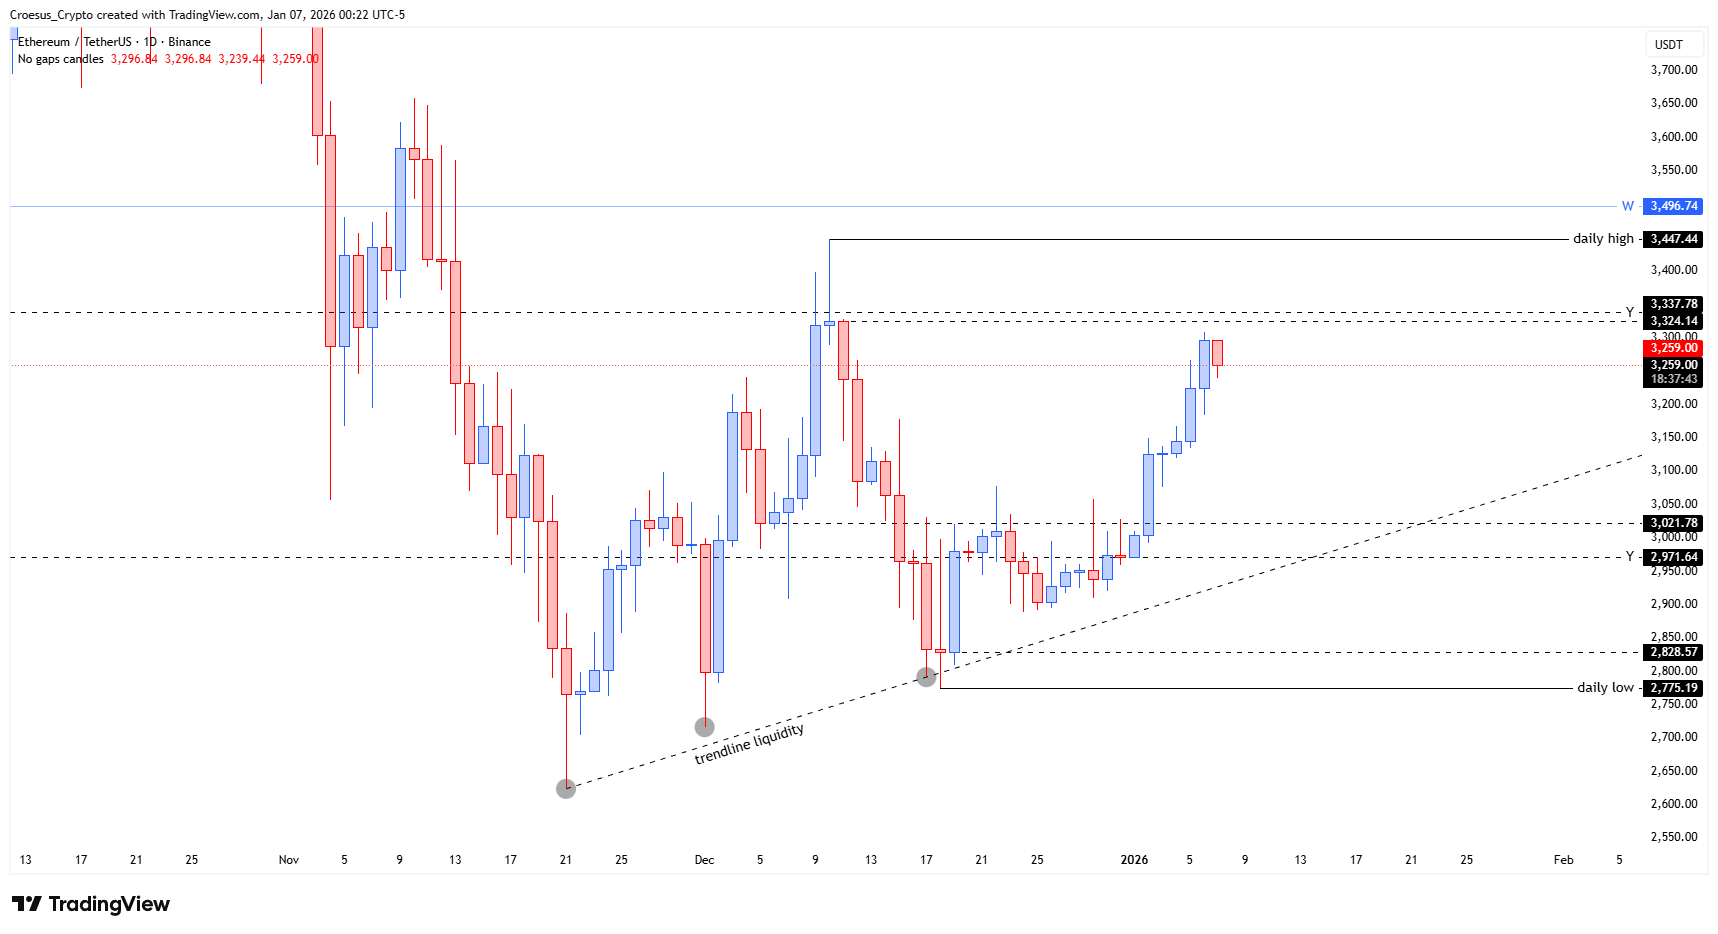
Ethereum daily chart January 2026 showing impulsive rally from 2025 close toward yearly open with nearby resistance levels.
Technical Analysis Key Points
- We had a yearly close. Therefore we will also briefly look at the yearly chart. Here we can see that price almost touches the yearly opening of 2025. Price covered the entire yearly candle in 6-7 daily candles.
- Back tp the daily chart : here we can see a clear bullish impulse covering the distance from the 2025 close to the 2025 opening price. We could the 2025 opening price to be touched today or at least in the coming days.
- As we a confluence of several key levels acting as resistance (yearly key level, weekly prior lows, daily high), we might expect that, after such an impulsive move up, we will see some relief. In that case we might expect a relief until the first structure at $3.021,78. We can not pull a decisive fib retracement as we don't have a bearish closed candle yet (the last candle is still open).
Market Structure Analysis
From a market structure perspective, Ethereum has printed a clean bullish leg from the 2025 close back toward the yearly open. On the daily chart this move is almost vertical, leaving little intermediate structure. The current area combines the yearly key level, prior weekly lows acting as resistance, and the recent daily high, forming a strong confluence zone that our technical analysis treats as a decisive pivot.
With no confirmed bearish daily close yet, we cannot anchor a precise Fibonacci retracement, but the context clearly signals that ETH is pressing into stacked resistance after a steep advance. Until we see a clear break and acceptance above the yearly open, this Ethereum daily analysis treats the move as an impulsive test of range highs rather than a confirmed breakout.
Key Levels and Scenarios
Bullish scenario:
If buyers manage to push through the yearly open and hold closes above the current resistance cluster, trend continuation becomes more likely, with the impulse extending into higher yearly ranges.
Corrective / relief scenario:
If resistance holds and ETH starts printing lower daily highs, a corrective phase is likely. In that case, a pullback toward the first structure around $3,021.78 stands out as a natural magnet, both as prior structure and as a potential alignment with deeper Fibonacci retracement once a bearish candle confirms.
Key levels to watch
2025 yearly open (~3,3k): Primary resistance and pivot for further upside.
Daily high / local resistance band: Short-term line in the sand for immediate continuation.
$3,021.78 first structure: Main downside target for a relief move and potential re-entry zone.
Trendline liquidity zone below 3k: Deeper support where buyers previously stepped in.
Trading Implications
For traders, this Ethereum daily analysis suggests caution in chasing longs into stacked resistance; higher-probability opportunities may come from waiting for either a confirmed breakout above the yearly level or a corrective move toward 3,021.78 to reassess risk-reward.
This content is for educational purposes only and is not financial advice or a recommendation to buy or sell any asset.